The use of software to aid in master planning is nothing new. At Payette, however, designers and engineers have collaborated to create new software tools to solve master planning issues as they emerge. “We have a range of really complex problems,” explains Jeffrey DeGregorio, a principal at Payette. “Because they’re part of these large-scale master plans, we need to represent them very clearly to be able to tell a story. I think Payette occupies this complicated little niche—complex organizations, complicated campuses.”
The homebrewed software projects began a few years back, with a Web-based tool that helps planners determine whether a given level of glazing on a building is compatible with winter comfort, or whether perimeter heating is needed. “That came from a particular problem we were seeing over and over,” says Andrea Love, principal and director of Payette’s Building Science Group.
“This is a big energy and comfort issue for the building. So, we focused a lot on upgrading the envelope and improving the daylight,” she says. While some of their tools are proprietary, this one, Glazing and Winter Comfort Tool, is freely available online.
Modeling for Sustainability
From there the questions got bigger, and the software got more ambitious. Payette worked with Cornell University on renovation projects and then on a master plan, always with a focus on environmental impact and conservation. “Cornell has very aggressive sustainability goals, and they are trying to get to carbon neutrality by 2035, which is not that far away. Building operations is their biggest source of carbon emissions,” says Love.
The university had a number of buildings that were outdated, and wanted to create a renovation that not only improved energy efficiency, but also better enabled today’s interdisciplinary research, collaborative learning, and other programmatic goals.
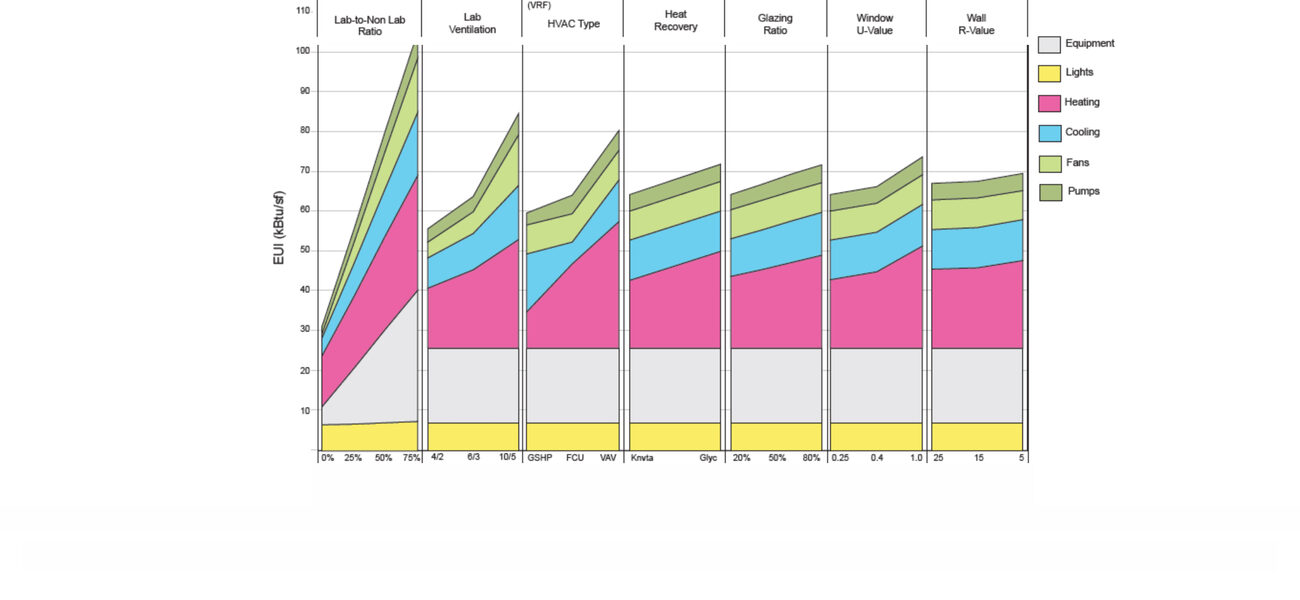
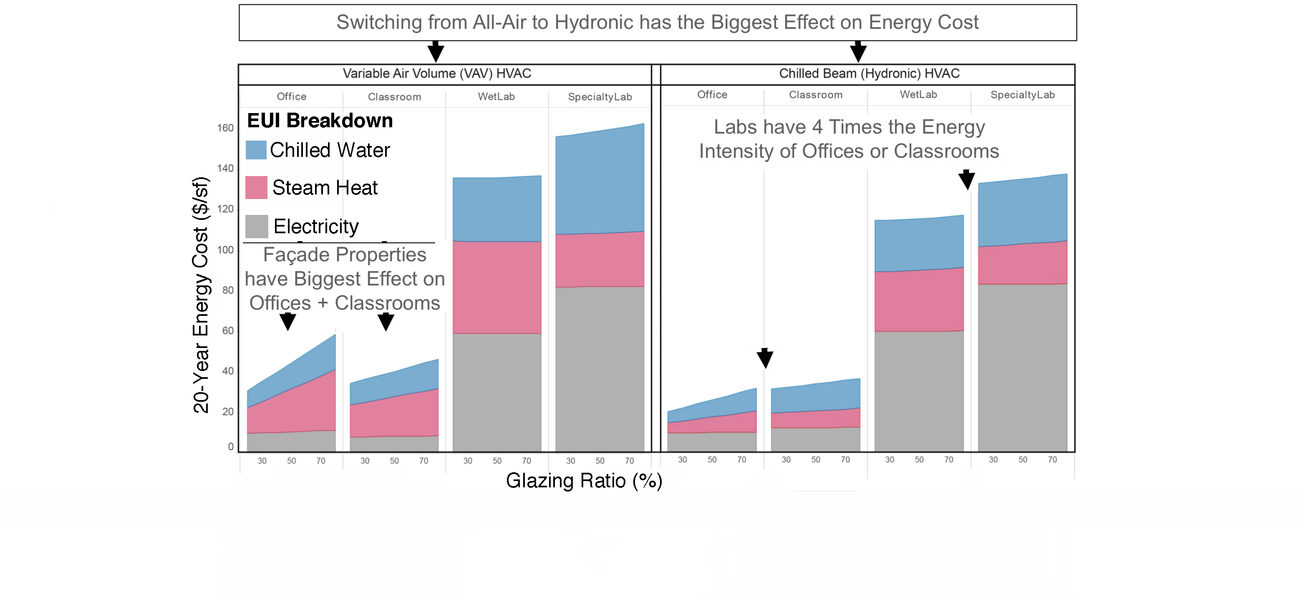
Improvements in big-data tools allowed the Payette team to build software that models energy use in a given space, for instance, an office, laboratory, or classroom. This sort of “shoebox” model is not new. What’s new is that they are able to model each space thousands of times, seeking the sweet spot of the lowest energy use intensity.
Each iteration contains a different combination of parameters that includes orientation, glazing, window-to-wall ratio, R-values of wall, U-values of glazing, HVAC types, and ventilation rates. Not only does the tool measure the effect of specific changes, but it also helps the team identify which variables make the most difference to the overall energy profile.
“If I know I am looking at a space that is on the west orientation, for example, I now see that I can’t have more than 40 percent glazing if I want to get to my energy use intensity target,” explains Love. “So, it quickly allows you to see what are the things that matter and what are the things that still leave me with lots of options.”
Sharing the tool with stakeholders at Cornell allowed them to be included in the data analysis and verify the decisions they made. It also allowed Payette to make some larger-scale statements based on the data. “Not surprisingly, the façade had the biggest driver on things like classrooms and offices. All-air systems versus hydronic systems for all space types made a big difference in energy usage. Labs were, on average, about four times the energy usage of the other spaces,” says Love.
Using the same basic framework, the team is able to model for any number of desired qualities in a space. “It’s not just energy—daylight, comfort, mechanical systems, envelope parameters, any kind of large-scale data set. We customize it for each analysis,” she says.
Data modeling using the open source Design Explorer tool also helped move Penn State’s University College of Engineering towards its energy goals. Some on campus had hoped to reach those goals in a west campus precinct solely by installing photovoltaic (solar) panels on the roofs. “Unfortunately, you need about 400,000 sf more than you have of roof area, if you want to just do PVs, or you need about four to five of those large-scale wind turbines,” says Love. “We could basically provide only about 23 percent of the energy from the roofs.”
Love says doing the simulations early in the project helps make the decisions clearer. “Energy modeling has often happened late in design, but in early planning, you need a way to quickly run through different scenarios.”
Where Are You? What Do You Like About It?
For a master planning project at Penn State, Payette’s software tools got even more ambitious. The idea was to shape the university into thematic precincts without walling departments off from one another. “How can we build a model that is based on shared resources that departments fit into, as opposed to starting with departments and figuring out their respective growth?” asks DeGregorio.
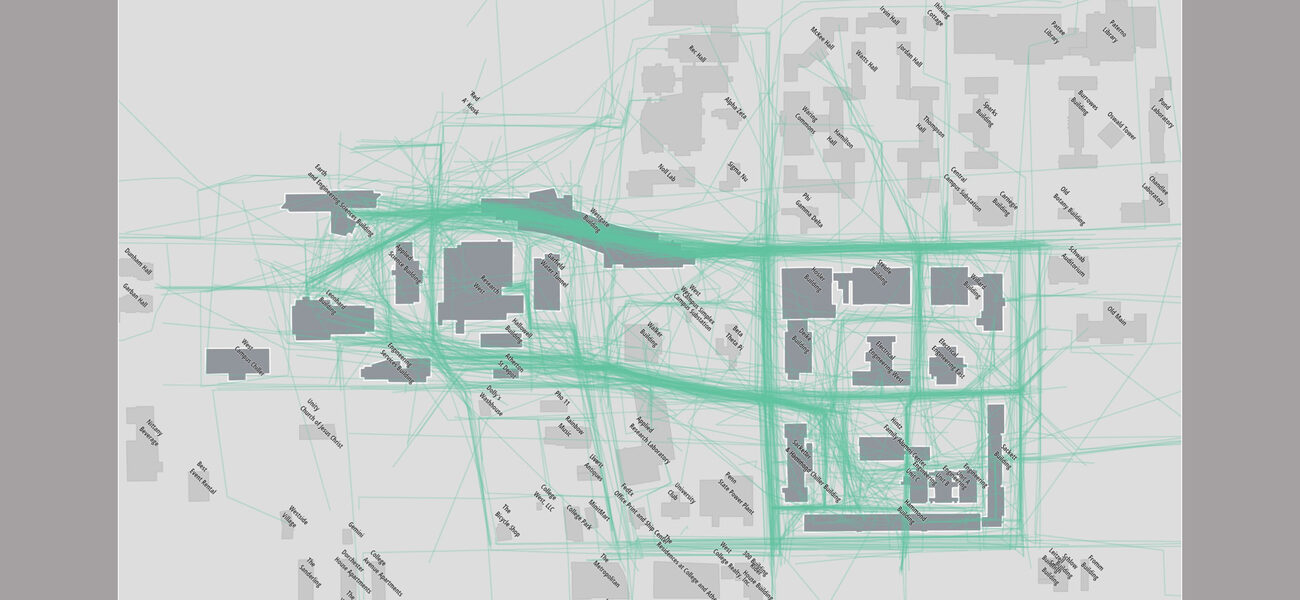
The team collected survey data asking students, faculty, and staff to describe where they went on campus on a given day, how they got there, and how they felt about each place. Mapping these data points provided information on common pedestrian paths, where classrooms are, where informal learning takes place, and the perceived quality of those spaces. This let the team make decisions that preserve spaces where people gather (a pond, for instance) and deprioritize buildings that get in the way of people reaching their goals.
“Students, faculty, and staff can fill it out from their phone or laptop,” explains Andrew Ringler, data visualization scientist with Payette. “They label points of interest on the map and common paths. For each of those points, we have them rate their experience. We had found that good tools for collecting this type of information did not exist, so again, we built an in-house tool we call Pulse. With Pulse, we can customize the survey experience for each client presenting users with a familiar campus map that is easy for them understand and fill out while also providing us with a rich set of spatial data results we can use for analysis.”
Tom Simister, director of space strategies at Payette, elaborates: “During a master plan you’re looking at whether the physical layout supports the way people on a campus envision themselves working in the future.
“We also need to understand an immense amount of information about a unique place in a very short amount of time,” says Simister. “These tools allow us to see what’s actually happening across all people, then prompt us to be more creative and to validate our ideas with their leadership.”
Renovate, Remove, Replace?
In master planning, the Payette team uses data modeling to help guide decisions for an entire campus or precinct. “The analysis methods for master plans are really key to identifying existing building traits, to signaling whether or not it is fit for renovation, or to augmenting, removing, or replacing,” says DeGregorio.
Because diagramming the large data sets can get complex, the team also sought more useful ways to visualize their data and allow stakeholders to see the results of changing different parameters. The Building Diagnostic tool helps identify the highest and best use of a given building, using inputs of about 20 different parameters.
So, why build specialized software? Love says the answer is simple: “Because these tools didn’t exist, and we needed a way to make the data and information available to clients.
“Maybe I’m just a nerd about these sorts of things, but I think it is pretty exciting.”
By Patricia Washburn


