New metrics for designing scientific research space measure the predictors of human interaction in a research environment. While traditional metrics measure productivity in quantitative terms, new metrics—based on interaction, sustainability, and performance—look at qualitative factors to determine what type of environments encourage collaborative research.
“Science is a collaborative enterprise, so it’s important to think about what brings people together to create effective research teams,” says Stephen Bartlett, associate principal at Ballinger. “We are always attentive to the traditional metrics—net to gross, cost per square foot, performance, spatial efficiency—but those aren’t the main things we think about when we design research facilities. We spend our creative energy considering what sorts of environments facilitate interaction to encourage research breakthroughs and ask ourselves what factors we measure to compare different environments. In the past, we haven’t had a lot of metrics to talk about those things.”
Traditional metrics for research environments include efficiency net to gross; lab-to-lab-support ratio; linear foot of bench per researcher; and construction cost dollars-per-sf productivity measures. New metrics consider interaction predictors such as space and systems convertibility and flexibility, and low energy use and energy use intensity (EUI). Designed for use in conjunction with traditional efficiency and cost-based standards, the new metrics provide a perspective on designing research buildings that will foster sustainability, collaboration, and research breakthroughs.
“The traditional metrics are well ensconced,” says Bartlett. “People want to know there will be a good return on investment in the building. You can’t escape that, and you shouldn’t try to. The new metrics are intended to create buildings that facilitate dynamic research environments without sacrificing cost and efficiency.”
Inventing a New Checklist
During a project for the University of Wisconsin, Ballinger helped Gwen Drury, a consultant for the Wisconsin Institutes for Discovery (WID) building project in Madison, develop and test a comprehensive template of core values that drive interaction: amenity, visibility, community, and density. The SEED (Socially Ergonometric Environmental Design) checklist, based on the LEED checklist model, categorizes how people use space in six broad areas—place making, flow, perceptual access, territoriality, spatial relations, and biophilia (a person’s affinity for the natural world)—and assigns a point value to each category.
“Following on that experience, we wanted to develop a series of metrics that would be simple to calculate and allow us to compare one project to another over time. We’re trying to answer the question, ‘Why does one project have more potential to encourage and foster interaction than another?’” says Bartlett.
Clients want to know all the traditional metrics on a project, including specific square footage, number of labs, and number of desks. They also want the resulting design to help draw people together in a collaborative environment, which leads to talking about “draws” for interior space. These draws are distilled into a series of metrics to help determine a project’s interaction-encouraging factors:
- What is the ratio of assigned FTE seats to open seats available for interaction?
- How many people share food or coffee stations on a research floor?
- How many people share a perceptible spatial neighborhood? This metric measures the number of people in a work community or the number of people visible from an employee’s desk or work area.
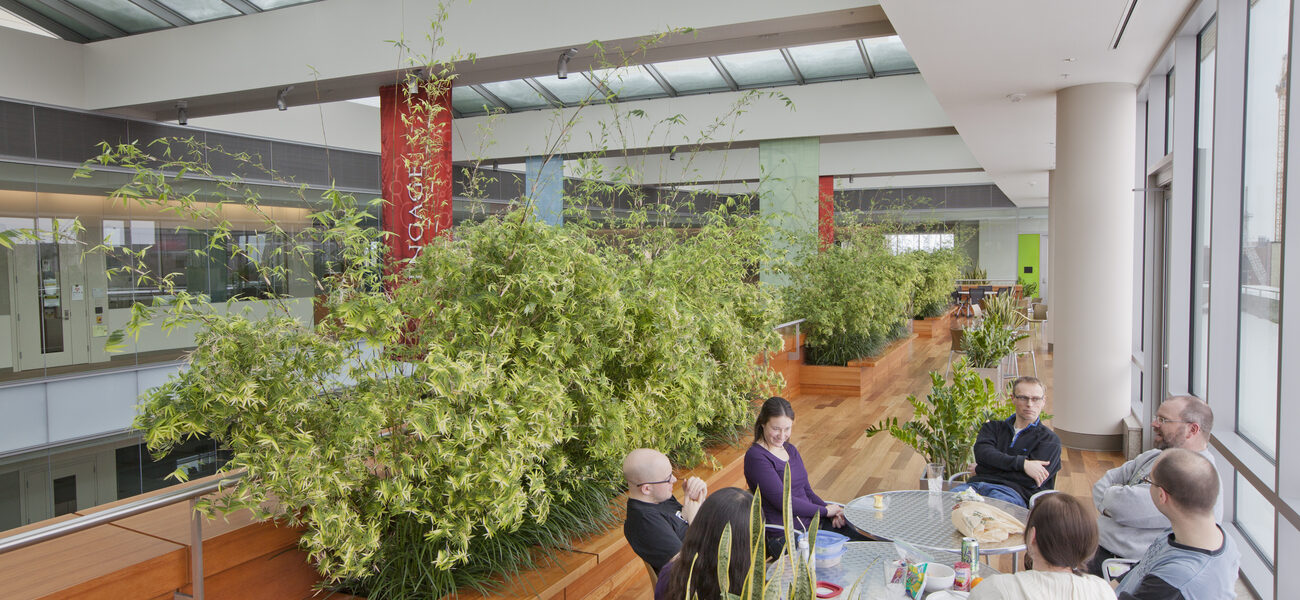
- What is the ratio of draws (amenities) to personnel on a research floor plate? Draws include coffee areas or kitchenettes, open stairwells, open meeting space, and soft seating areas. This metric is based on the premise that creating more opportunities for people to meet face to face promotes collaboration.
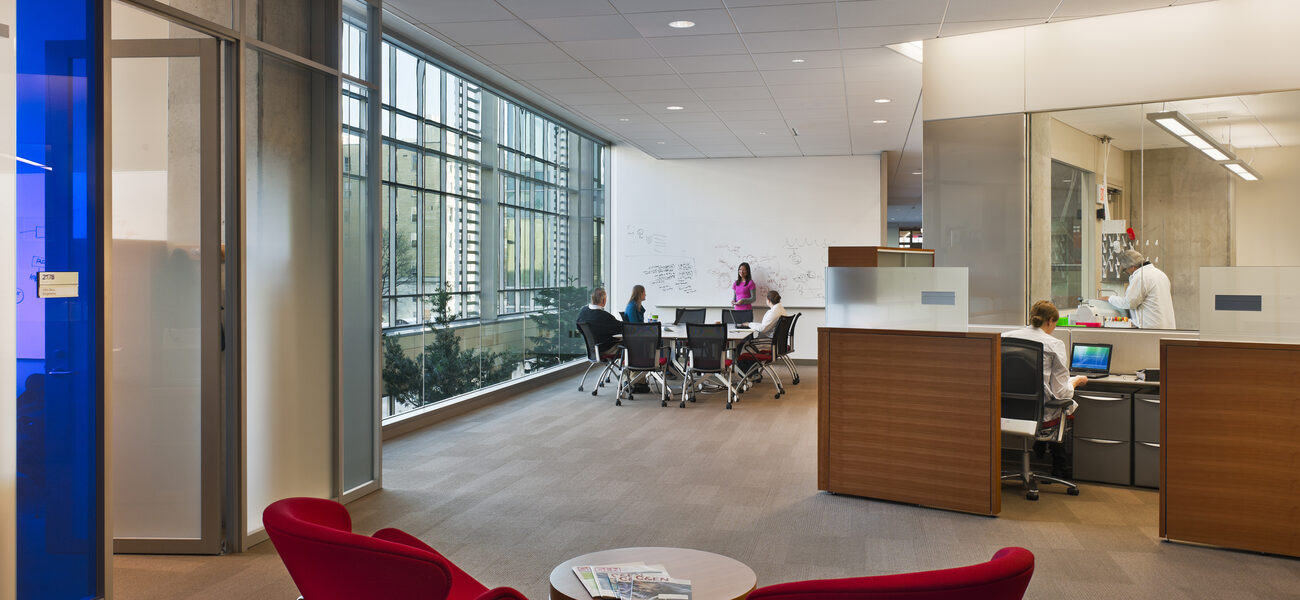
- What is the numerical average of people per room on a research floor plate? This metric looks at the number of people who work in enclosed offices, which are considered less conducive to collaboration, compared to the number of people working in collective open spaces.
The Projects
The Johns Hopkins University undergraduate teaching lab, a 105,000-gsf facility completed in 2013, typifies a recent project where the new metrics directly impact design. With research space on the upper levels and undergraduate classrooms on the lower levels, the building provides space for biology and chemistry teaching and research. The design takes advantage of a wooded setting with a wall of windows on the northern side of the building, where the exposure eliminates potential solar heat gain. Corridors and passages are organized with plenty of places to sit and talk. Open stairwells, break areas, seating areas, and meeting spaces create draws.
In terms of project costs, designing with the new metrics adds value without necessarily adding to the bottom line. The Johns Hopkins project keeps costs in check: floors are polished concrete, the ceilings remain open, the walls are painted drywall, and the lab equipment is high quality rather than high-end. “This building is envisioned as a place where researchers and students come together and mingle. The building facilitates this while still allowing each realm its own environment, and ensuring value and return on investment,” says Bartlett.
The new metrics are easily applicable to institutional as well as corporate environments. On a project for West Pharmaceutical, the final design includes virtually no individual offices. With the exception of two platform leaders, employees work in an open environment. Lab space is open concept, with reporting stations and desks for lab workers located outside the labs. “We end up with a much higher number of people sharing a room because we have so few offices in this plan. The building has 30 people per spatial neighborhood, sharing a food and coffee venue,” says Bartlett. “We also have a slightly lower interaction/seat ratio, which is typical for corporate environments.”
Quantifying the Results
Ballinger conducts post-occupancy studies to evaluate how well the new metrics, and the buildings themselves, hold up over time. “We think about these interaction metrics as we draw and conceive the buildings. The next step is quantifying the results to see if our hypothesis is validated,” says Bartlett. Comparing data for 10 recent Ballinger research buildings, including Johns Hopkins, completed over a 10-year period and conceived using the new interaction metrics, Bartlett notes a general increase in measured interaction predictors. Specifically, he evaluated draws per FTE, average FTE per room, and ratio of open seats per FTE. “The data makes me think there is something to this. We have been looking at these metrics all along, intrinsically, and we are trying to be much more conscious and deliberate about it going forward, because we think this is one of the real drivers for research buildings of the next generation.”
By Mary Beth Rohde
This article is based on a presentation Bartlett gave at Tradeline’s 2013 International Conference on Research Facilities.

