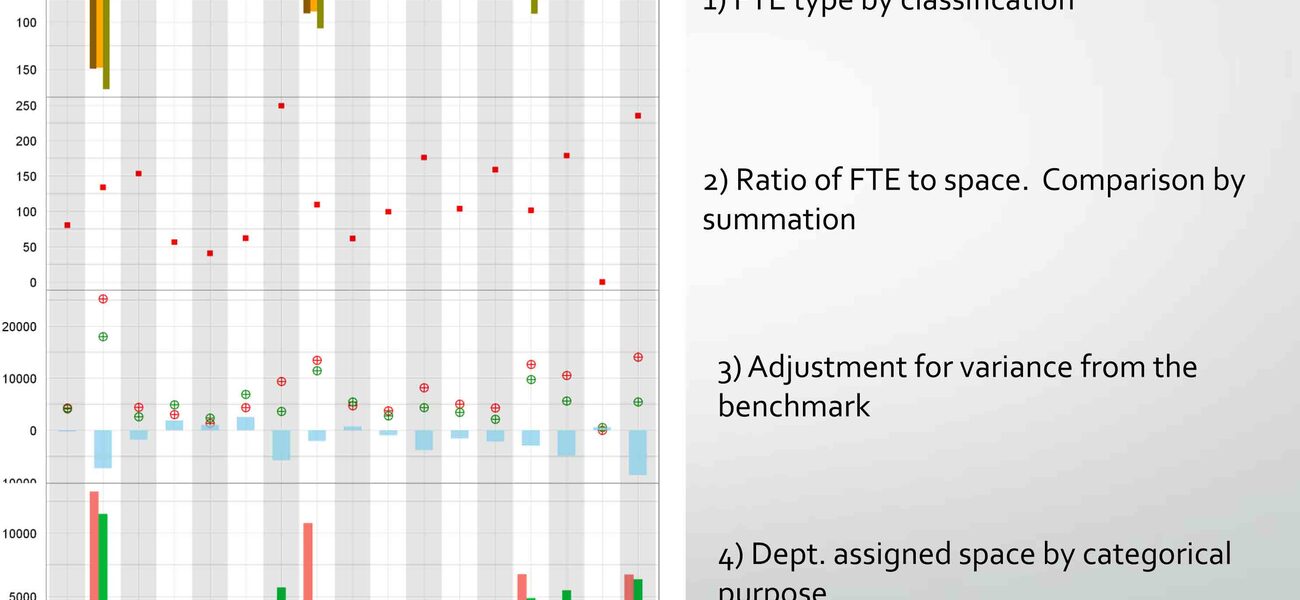
Space allocation can be a political minefield, but Stony Brook University School of Medicine (SBM) is changing that paradigm. Old-style backroom negotiations are being replaced with a wholly transparent decision-making approach that utilizes information technology to democratize space allocation and provide department chairs with an unprecedented wealth of information about their space and staffing, past, present, and future.
The initiative was born in 2013, when a new vice dean for research mandated a full review of SBM’s space. To make it happen, Glen Itzkowitz, SBM’s associate dean of facilities and operations, assembled a space management utilization committee composed of department chairs, faculty, department administrators, informaticians, and architects.
Together, the committee compiled an initial dataset and searched for ways to evaluate it. Two approaches particularly caught their attention: an FTE-based metric used at UC Davis School of Medicine, and a metric from Wayne State University School of Medicine emphasizing awarded research dollars smoothed over three years and total direct cost.
Although the Wayne State model used somewhat different figures—SBM has historically tracked research dollars expended rather than research dollars awarded, and direct cost dollars rather than total direct cost—it was appealing because it looked at the ratio of actual activity to target activity in a range of areas. And the UC Davis model was appealing for its focus on FTEs —“the most direct correlation of the expenditure of the direct cost dollar,” according to Itzkowitz—as well as its separate consideration of laboratories in different categories: wet and dry, and conventional and open bay.
Metrics and Benchmarks
The committee’s top priority was to devise the best possible space allocation metric for SBM, one that would preserve its unique strengths and identity while representing each department as fairly as possible. Flexibility would therefore be essential.
“We understood, going into this, that not all dollars are equal,” says Itzkowitz. “In some disciplines, fewer dollars can have more of a profound impact. To apply the same standards to all disciplines would risk compromising the broad diversity of science we have here at Stony Brook Medicine. We didn’t want to just count dollars per square foot.
“So at first, we said, OK, let’s do this as two distinct metrics,” says Itzkowitz. “Let’s give the dean’s office the macro picture of dollars per square foot, and let’s give the department chairs the research FTEs per square foot. And that’s where things got interesting. The committee said, no, we like both of those things, but we like them together.”
The committee developed a hybrid model that gives equal weight to both the FTE and the direct cost metrics.
Next, they developed target metrics to steer future space allocations, starting with lab-based research space, which encompasses shared support and office spaces in the labs, as well as lab space proper. After classifying SBM’s lab-based research spaces as wet or dry, and modern or vintage, they analyzed the wet and dry lab spaces separately on both dimensions—wet labs in terms of wet FTEs and wet direct cost, and dry labs in terms of dry FTEs and dry direct cost. Distinct benchmarks were set for each kind of space.
The FTE benchmarks took into account the fact that modern lab space is more “FTE-to-mission neutral” than vintage lab space, and the fact that nationally an R01 NIH grant supports 3.25 FTEs, but in metropolitan New York it supports 2.75 FTEs. The committee set the standard for modern labs at 120 sf per FTE, and for vintage labs at 160 sf per FTE. Benchmarks were also set for administrative space, based largely on State University of New York Construction Fund standards: 100 to 110 sf for faculty offices, 130 to 150 sf for chair offices, and 60 sf paired with 20 sf circulation per administrative staff FTE.
A space allocation target of $250 per sf in research funding was set for wet bench research space. (When the committee’s first reports were developed, the mean at SBM was $160 per sf; the current national average, at the low end of the scope, is $325 per sf.) The space allocation target for dry research space was set at $500 per sf in research funding, the rationale for the larger figure being the higher compression factor for dry space (there being more dry researchers per 1,000 sf of dry research space than there are wet researchers per 1,000 sf of wet bench research space).
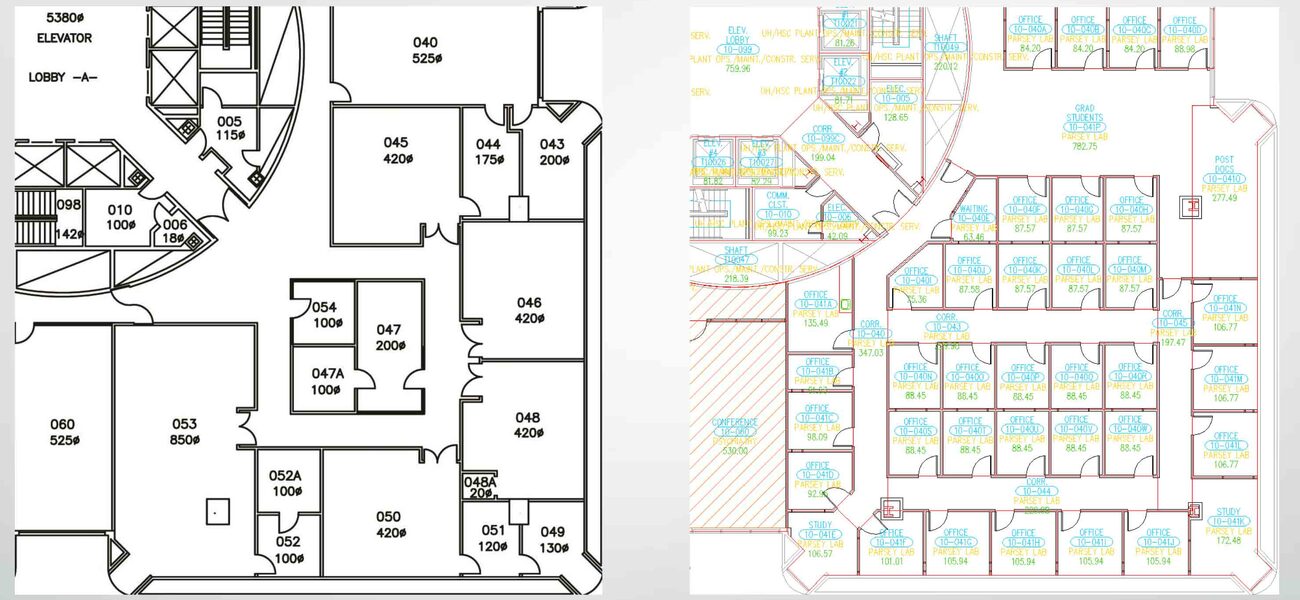
Applying the benchmarks in a tower of the 1.1 million-sf Health Sciences Center complex, which houses 22 SBM departments, has achieved gains that are above trend lines for both dollars per square foot and FTEs per square foot. In the original 1970s design by Bertrand Goldberg, each of the tower’s 20 floors is divided into four quadrants joined by a generously sized circulation zone at the center of the floor plate; Goldberg envisioned each quadrant as a “neighborhood of discovery,” with labyrinthine hallways and smaller laboratory spaces. Under the new benchmarks, the renovation of a dry lab behavioral science quadrant expanded the number of offices from 17 to 40 while netting an additional 200 sf; in a wet bench quadrant, renovation and creation of an open plan lab environment increased usable space by 10 percent.
The Incentive Model
The purpose of benchmarks, of course, is to rightsize departments and redistribute space. But real life doesn’t always conform perfectly to abstract standards, and it seemed likely to the committee that some departments would feel that, in order to do their best work, they would need more space than the benchmark would prescribe.
To give departments some say in the matter, SBM is implementing an incentive model, based on one pioneered at University of Michigan Medical School, which assigns dollar values to square footage. A relatively oversized department that does not wish to relinquish any of its square footage to meet the benchmark can simply pay extra to retain the space.
Readily expandable and adaptable to accommodate changes in size, scope, and other variables, the incentive model is a powerful tool that allows SBM to pool surplus space for future thematic growth.
The Space Portal
SBM department chairs seeking additional space, or a renovation of their current space, make their requests through a dashboard-level online space management tool called the space portal.
The space portal “does away with the book of deals,” says Itzkowitz. “You don’t come in and swing your best deal to the leadership. You’re forced to go through the process of putting the request into a system online that does the calculations and figures out exactly if what is being requested is deserved or earned. Decisions are made that are fact-based and evidence-based.”
In addition to helping govern and democratize the process of submitting, evaluating, and approving requests, the space portal also provides departments with a valuable, data-rich perspective on their staffing and space. “The departments have direct access to all of their benchmarks and data,” says Itzkowitz. “They can even drill into it on a faculty level. So if they’re considering increasing space for Dr. X over some period of time, they can look at what Dr. X has been doing historically, and what her trajectory seems to be, before they make a commitment.”
Itzkowitz’s group has taken great pains to link the portal to as many reliable data streams as possible, including space management data from Advanced Technology Group, PeopleSoft employment data, and Oracle®-based data on grants and grant activity expenditures.
“To pull all of that together can be an effort,” says Itzkowitz. “But once you have the data streams in place, the data just populates itself year after year.”
Culture Change
SBM plans to include a facilities condition index in the next physical space inventory update, slated for 2017. SBM is also working with technical partners to dynamically link pre-award routing platforms for grants and contracts.
“We’re starting to contemplate how the studies of these reports can be integral to broader campus initiatives and shared services modeling,” says Itzkowitz. “And we’re going to update this report annually, as we have all along. This wasn’t a one-trick pony; it’s a living, breathing thing that is changing the culture here.”
By Deborah Kreuze

