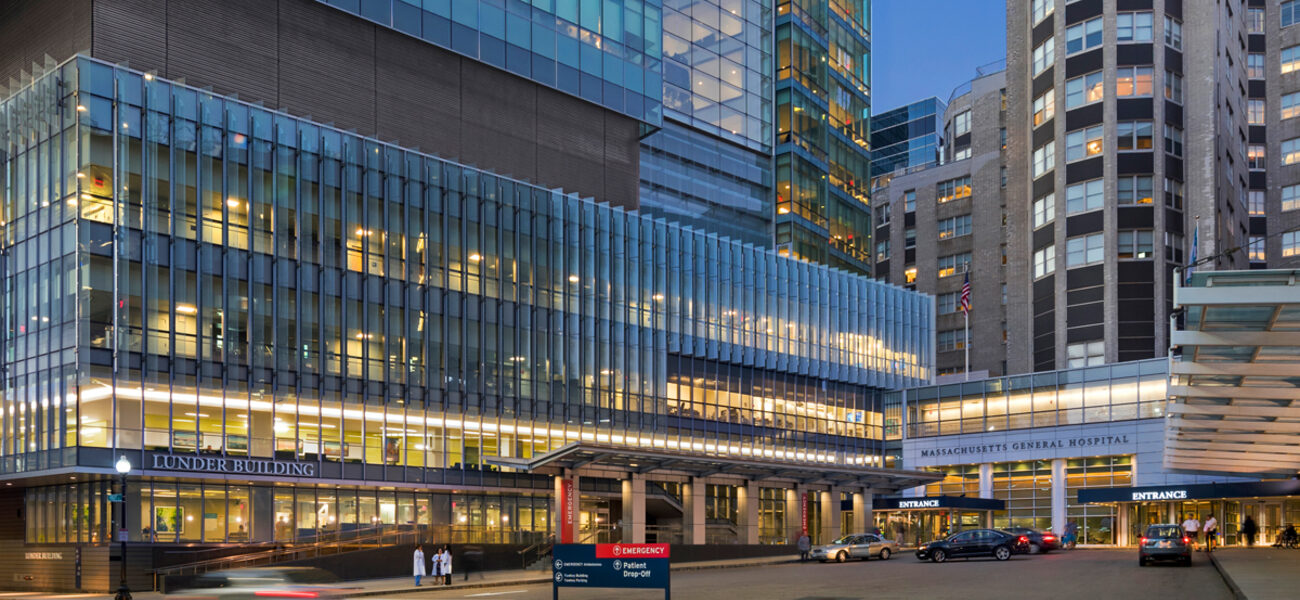
Massachusetts General Hospital (Mass General) in Boston is developing new methods and metrics for accurately analyzing space use data to determine how efficiently scientists utilize expensive research space. The new approach helps administrators use objective, defensible data to properly distribute limited, high-value space and resources. By leveraging the extensive data available in its custom relational database, the Research Space Management Group (RSMG) can track all research space, as well as the various types of research programs assigned to that space, including on-site, off-site, laboratory, and support spaces.
The relational database—called the Research Space Management System (RSMS)—was implemented in 2014 and is currently in use at three Partners Healthcare hospitals (Mass General, McLean, Brigham and Women’s). Integrated with a strategic collection of other software systems that serve up the core data—including MicroStrategy, AutoCAD Architecture, and Archibus—the RSMS provides a robust multi-layered data model for analyzing the utilization of research space, staffing, funding, and equipment. The system allows administrators to overlay grant dollars, headcount, and space use data to identify improvement opportunities.
“Analysis of space use is an ongoing process,” says Kathleen Garrity, a space analyst for the RSMG. “The new system is just one of the tools we have to gather and analyze data. Research space is limited and in high demand. We use these metrics to gauge if departments need consolidation, or if a department is carrying its weight. It allows for objective, data-driven decision-making while minimizing internal politics.”
Mass General has the largest hospital-based research program in the United States, with nearly 1.3 million sf of research space, 2,000 funded principal investigators (PIs), 4,000 scientists and research staff, and a research budget of $910 million in 2017.
“We track all activity for research space, grants, staff, and equipment at the PI level,” says Michael Fisher, director of RSMG. “Grants, or portions of grants, and space all get assigned to a PI’s site—which is space in a building, on a floor, in a room or group of rooms assigned to a specific principle investigator. The data from that rolls up to a unit site; the unit, the department, and the entire hospital. This allows us to do a very sophisticated analysis of space use at any one of those levels.”
One of the unique features in the way Mass General gathers space data is that research activity is tracked not by the department that obtained a grant, which is how most research institutions track research funding, but rather by the research activity at the site where the work actually occurs, even if it is in another department.
“For example, if a urology researcher is awarded a grant, and 80 percent of the work occurs at his site, while the other 20 percent of the work occurs at an imaging site, we will allocate it that way—by the location. This gives us a much better idea of the people working in the space, the actual research activity, and the funding occurring at any particular site,” says Fisher.
PI Site Metrics
Much of the core information for the RSMS is fed into the system automatically, including grant data, equipment specs, and user occupancy. Then it gets manually assigned by RSMG analysts to the proper PI sites. The system tracks metrics for room use and sub-use, as well as details like room design and sub-design. PI sites are also designated by categories, such as basic research, clinical trials, and computational.
“Except for equipment, we can assign every data point to a PI’s site in any percentage from 1 to 100 percent. For example, a room may be 127 sf, but only 42 percent of it may belong to a particular PI. The database can quickly tell us which PI’s site it is, who got the grant, how much the grant is for, and its termination date,” says Fisher.
In addition to usage and funding, the system tracks specific space information, such as the linear feet and number of benches, whether it’s on-site or off-site, and if the site is under construction.
“We do look at the ‘modified total direct cost’ (MTDC) per square foot at the PI site level and then calculate the MTDC density, which is the total modified direct cost spent at a PI site divided by the number of square feet. We formerly used that density as a measurement for activity but realized that MTDC density does not allow us to compare actual space costs with space-related grant income, otherwise known an indirect cost recover. So, we started using indirect cost recovered per site—the total grant indirect cost recovery of that site divided by the net assignable square feet (IC density),” says Fisher.
Advanced Metrics
While many metrics, such as MTDC density and IC density, are widely used in space planning at other institutions, the Mass General team developed more advanced cost, space, and occupancy metrics in an effort to quantify how efficiently scientists are utilizing their resources.
“Our goal isn’t to measure the quality of science being done, but to measure how efficiently the researchers are utilizing their resources, so we can make objective interdepartmental comparisons and decisions,” says Garrity.
One of these advanced metrics is the “total potential cost of resources,” which is total MTDC that a PI site generates multiplied by the maximum percentage of overhead funding that PI site could receive from each of its grants (i.e. the indirect cost rate).
Another new metric is “total space cost recovery.” This is the percentage the PI site recovers to pay for its space—which is the amount the site contributes for facilities divided by its total space cost. This is measured along with “space contribution,” which is the amount that the hospital covers to pay for a PI site that the site is not recovering from its grants.
The team also developed refined metrics for measuring the number of full-time equivalent (FTE) hours that are expended in a site.
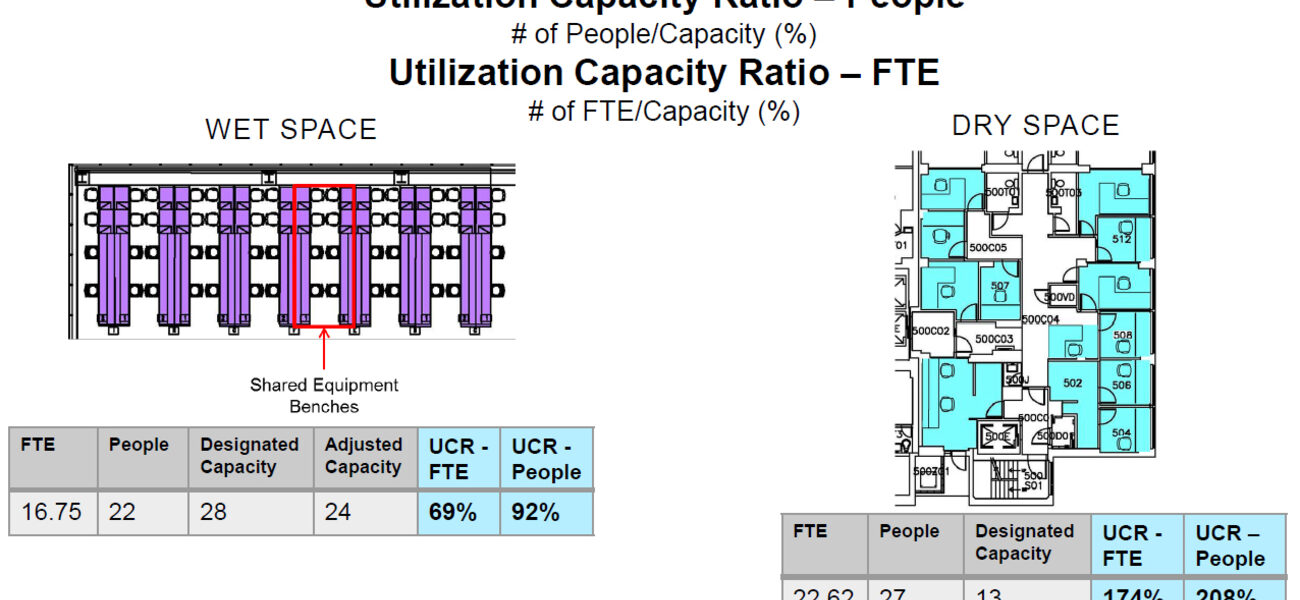
“There are many shortcomings with just using a simple FTE metric, so our group is aiming to expand available descriptive metrics. The new name we’re using is ‘use-capacity ratio’; there are two different categories of those,” says Garrity.
One category is the “use-capacity ratio for people,” which is simply the assigned headcount for a given space divided by its capacity. The second is “use-capacity FTE,” which is the number of full time employees working in and occupying the space divided by the total capacity.
“For example, if there are two part-time people working in a space, that would equal one FTE, whereas one fulltime person in that space would also equal one FTE,” says Garrity.
“The thing to keep in mind is that a metric that merely measures ‘dollars per square foot’ isn’t sufficient for measuring the efficient use of research space, because it doesn’t provide a complete picture. For that, you need a sophisticated data analysis methodology. Whether you use spreadsheets, a customized solution like ours, or a commercially available one—you need a system that consistently and accurately collects data and allows you to analyze it to come up with good decision-making numbers,” says Fisher.
By Johnathon Allen

