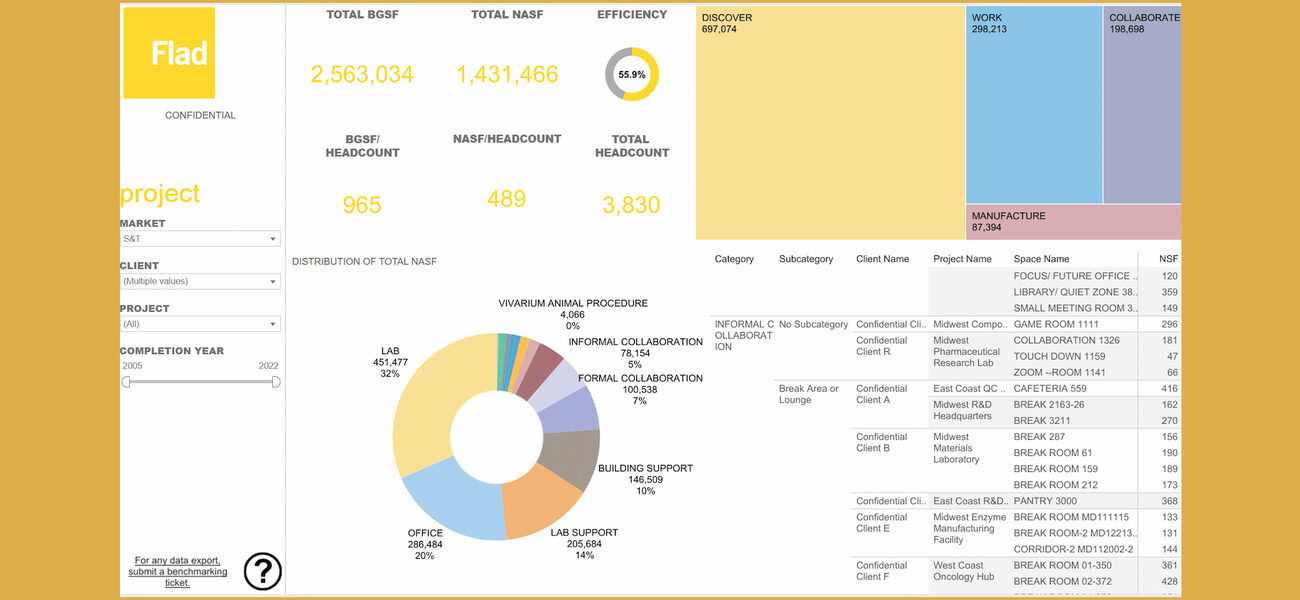
Collecting “big data” is always a good first step for benchmarking, but the data will benefit facility design only if there is an equally strong system for applying it to make informed decisions. Using a variety of technology tools, Flad Architects of Madison, Wis., has developed what they call a data warehouse, a central place where everyone within their firm can store and evaluate data to use when benchmarking space metrics across all projects in all sectors. Both qualitative and quantitative data collection methods are used to conduct space utilization studies including new sensor technologies that provide a high level of accuracy.
“When we just take the data and look at it from a purely quantitative perspective, we can sometimes miss the boat,” says Laura Serebin, architect and principal with Flad. “The most meaningful way to optimize design is to dive into the data and really try to understand the qualitative and operational factors that influence that data and how it can be applied to process improvements that will ultimately lead to a design that maximizes the available space.”
Serebin recommends that the team of people participating in front-end planning grow beyond just planners and architects to include people who can manage data and develop a strategy for analysis. Led by Elizabeth Strutz, director of process innovation, the team at Flad is comprised of design researchers, data analysts, computer engineers, computer scientists, and computational designers who work hand-in-hand with both architects and designers.
Standardizing Data Collection and Storage
“Flad has been around for a long time and we have lots of projects and lots of data, but until recently we never had one central place for all of the data, or a standard way of measuring the data and calculating metrics,” says Strutz. “We also knew that we wanted to develop a flexible process that didn’t just live with one person in an Excel file on their computer, but instead would be a tool that is readily accessible by the entire firm.”
Strutz explains that the process of creating a standardized central benchmarking database involves three main steps: defining benchmarking, selecting the metrics to benchmark, and creating a flexible platform to store and analyze the data.
Solidify your definition of benchmarking. Since there are many variations of the term, Strutz emphasizes the importance of agreeing on a definition that everyone within the organization will adhere to. She adds that the definition should be evaluated frequently so that it reflects any evolutions of the firm’s internal mission or changes taking place in the external marketplace.
Flad currently defines benchmarking as a data-driven process that integrates space planning variables, operations, and human behavior to optimize the allocation of space.
Specify what metrics will be benchmarking. Strutz explains that metrics chosen to be included in a central benchmarking system will vary from firm to firm and will also change based on market fluctuations, which is exactly what happened pre- and post-pandemic. She cites the metric of counting how many seats are filled in a workplace as an example, since this is much different now as more staff continue to work from home or have varied schedules. In healthcare, the number of tele-visits would most likely not have been a standard benchmarking metric pre-pandemic, but is now commonly used.
“To choose what metrics to include in our data warehouse, we had a core team that evaluated published methods from FICM (Facilities Inventory and Classification Manual), BOMA (Building Owners and Managers Association), and AIA (American Institute of Architects),” says Strutz. “Most importantly, we also talked to our clients to learn how they define space metrics.”
Strutz adds that the team even standardized the color schemes that are used on all layouts and floorplans. “It’s amazing how such a little thing like always using specific colors to represent specific work areas on layouts has helped our staff and our clients visualize proposed designs and changes.”
Creating a Flexible Platform
Serebin explains that since each project has unique parameters, the platform chosen for the data warehouse needs to be flexible enough to analyze the quantitative application of data as well as a qualitative assessment of how the data is applied.
“We wanted to make sure that we were pulling the data from the source and not relying on somebody to be manually entering data points,” says Serebin. “We developed a workflow where we pull space metrics directly from our Revit® model.” She adds that there is also an intake form detailing qualitative information about each of the projects, and a quality control process where a staff member reviews it for final accuracy.
Specific technology tools that Flad uses for its data platform are:
- Revit® BIM software, which uses built-in automation for documenting design
- MySQL, a relational database management system that uses the SQL query programming language
- Microsoft Power BI, used to unify data from many sources to create interactive dashboards and reports
- Tableau software is used for more advanced, interactive data visualizations
- Excel, which is reserved for more standard visualizations
Using Both Pre- and Post-Occupancy Data
“In the past, we would do only a post-occupancy evaluation, preferably after one or two years of occupancy,” says Serebin. “We now routinely also conduct a pre-occupancy evaluation so we can document the baseline condition at the beginning of the project. This baseline is what we measure against during the post-occupancy evaluation, and it also holds us accountable to the metrics we need to design to.”
Serebin explains that Flad now takes a more rigorous approach to qualifying or aligning data upfront in the process.
“We can use our benchmarks but we have to go through pre-occupancy analysis to qualify that data,” says Serebin. “After qualifying the data, we can take an informed look at options and scenarios to test and see how different variables might impact the equation. Finally, at the conclusion of the project, we can measure and see if the assumptions achieved the outcomes that we had intended.”
Data Collection Methods
Serebin emphasizes the importance of thoroughly understanding what needs to be measured before beginning data collection, in order to select the best collection method. Data collection tools fall into three main categories: occupancy and space utilization, productivity and space efficiency, and environmental factors affecting the space. Collection methods vary from using broad surveys or focus groups to installing very advanced sensors that precisely measure an occupant’s movements:
Surveys – Although surveys are a great way to collect data from multiple people, Serebin explains that the final static survey results usually generate additional questions about the data.
“By importing the survey data into Power BI, you can compare the survey results to other benchmark metrics that have already been collected,” says Serebin. “You can dig deeper into the answers by filtering the information by criteria, such as specific employee role, department, or years of service at the company.”
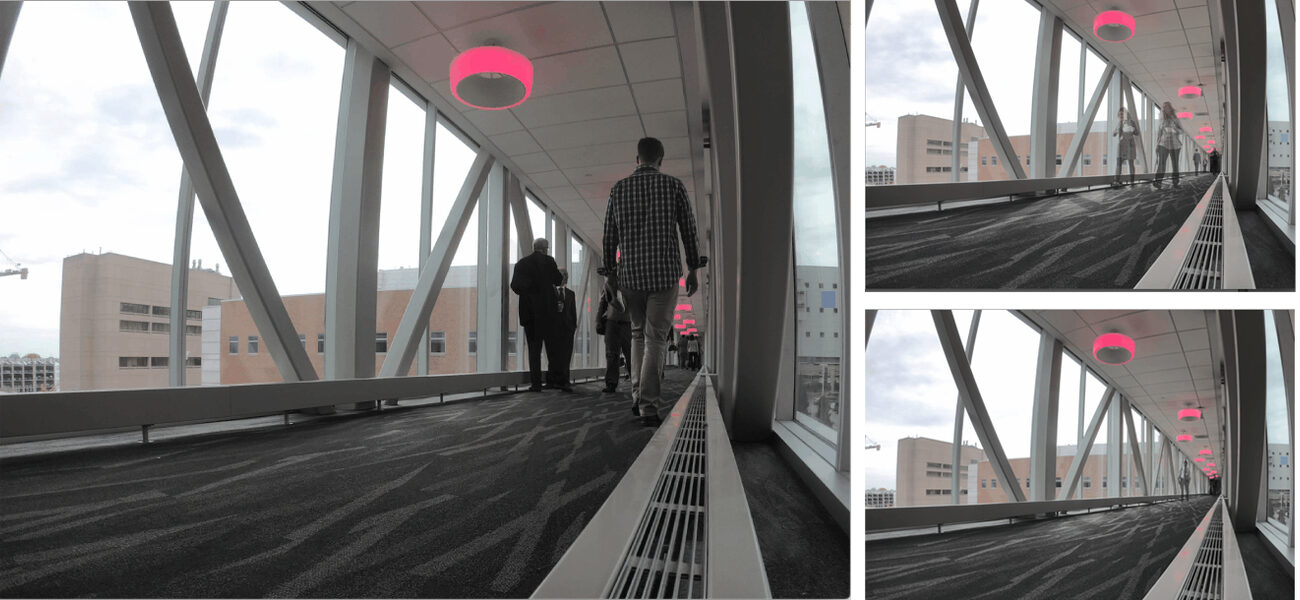
Time-Lapse Videos – Strutz explains that time-lapse videos are a very effective way to condense hours of observations into just a few minutes. She adds that this tool provides the ability both to observe the flow of people and record spontaneous encounters, giving a full look at the way the space is used.
Occupancy and Environmental Sensors – There are a multitude of different sensors available for monitoring occupancy and environmental issues. Sensors can connect and feed data to other smart devices and can easily be installed and removed so that data can be collected over specific time ranges. Another advantage of this type of sensor is that the data can be monitored remotely.
Occupancy sensors can be compared against scheduling data to evaluate a room’s actual use, which is especially helpful for conference rooms.
Positioning or Flow Sensors – This type of sensor is given to individuals on a key fob, so the sensor can track that person’s specific movements. The person knows they are being followed and that the goal is to analyze the efficiency of their movements. This type of study can help with positioning equipment and workflow in settings where workers have repetitive tasks, such as in labs or hospitals.
Putting Data Collection to Work
Strutz pointed to a post-occupancy evaluation for an academic workplace that they designed to show the range of data that can be collected for both benchmarking and for analyzing usage.
The new facility was designed (pre-pandemic) to create a collaboration hub for more than 35 different departments and academic divisions. Flad conducted a post-occupancy evaluation to study the number and types of interactions, both scheduled and unscheduled, taking place in the new hub. The school wanted to see how the space helped facilitate new encounters among faculty and students, crossing paths or creating more innovation “collisions” within the space.
To conduct this study, Flad used a variety of data collection methods, including direct observations, time-lapse videos, occupancy sensors, employee surveys, and scheduling data analysis. The studies found that on average, the conference rooms were not being used to the level the school would have liked. Some were quite highly utilized due to their location and, of course, the size and configuration of the room. The least utilized conference rooms were the ones with the operable walls.
“Everybody thinks that operable walls are going to help make a conference room more flexible and more highly utilized,” says Strutz. “We found that they were leaving the walls open, and were then using only a part of the room for smaller groups, which was not an effective use of space.”
“This was a good example of how we were able to use our data during the post-occupancy evaluation to make concrete changes that will make the space more effective. This is always our goal,” says Strutz.
By Amy Cammell

