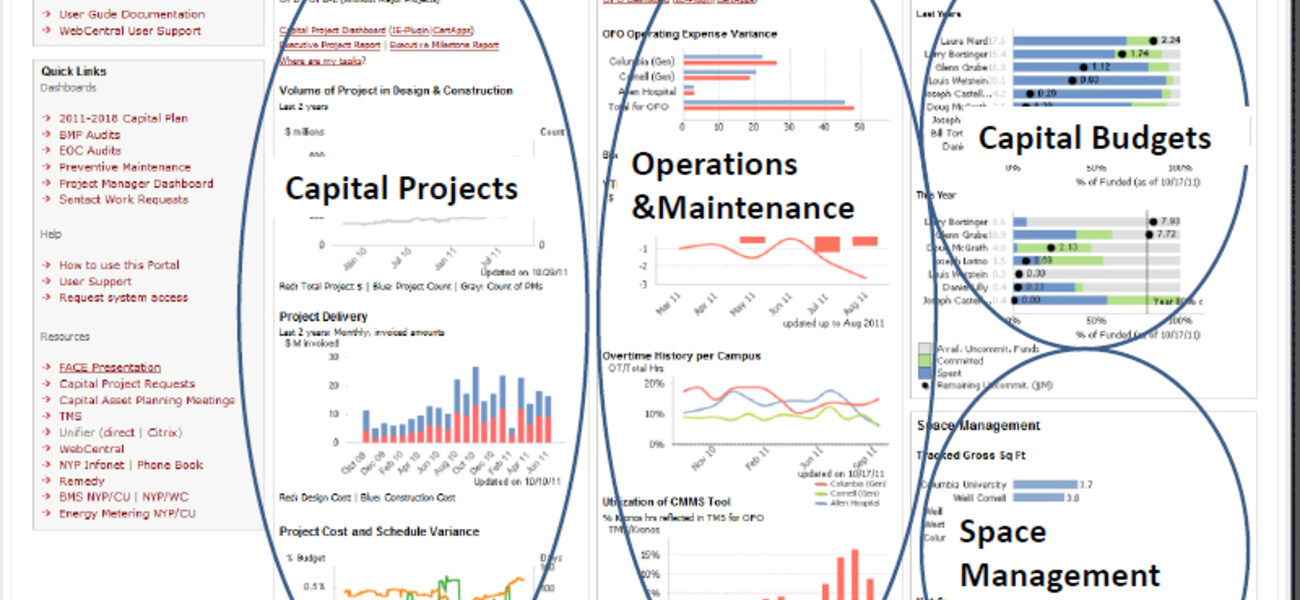
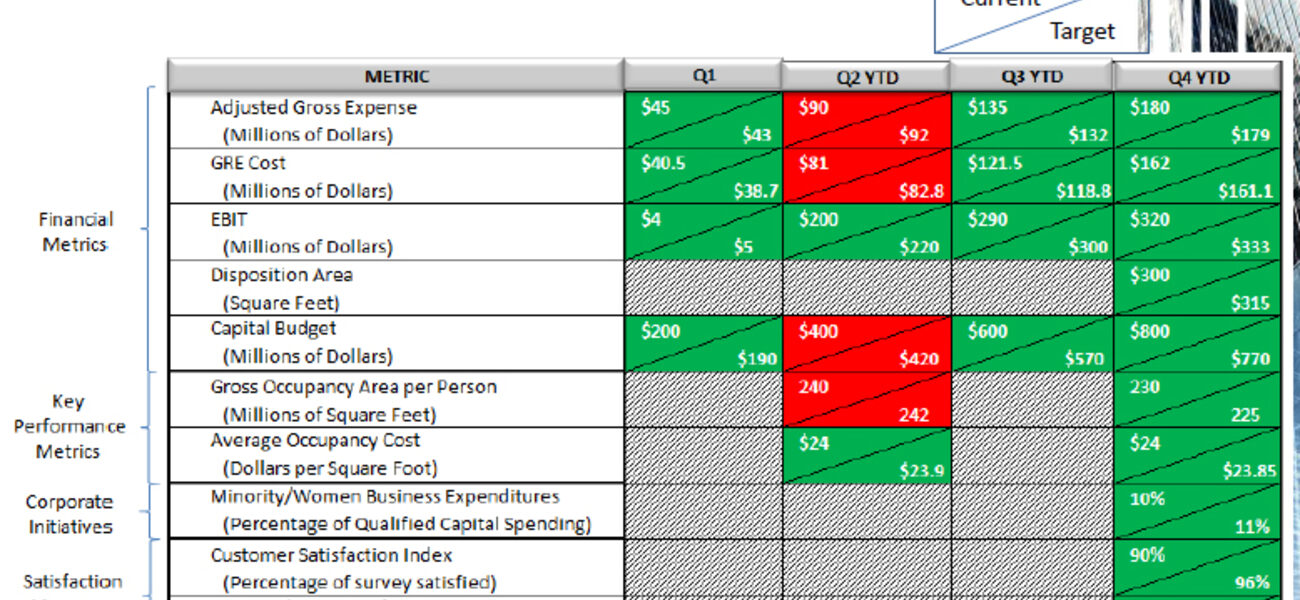
GlaxoSmithKline recently engaged Computerized Facility Integration (CFI) to develop an executive reporting dashboard that will give leaders the ability to track key performance indicators (KPIs) that help identify organizational opportunities and missteps. Once developed, this strategic information will help the real estate group quickly set a course to bring rapid improvement and reduced costs.
“Creating an executive dashboard isn’t just about giving you nice-looking charts and trends,” says Mayu Roy, managing director for strategic consulting at CFI. “It’s about giving you the transparency you need to see where you’re going wrong so you can quickly react.”
Much of the work involved with creating an executive dashboard comes down to defining the relevant KPIs and figuring out how to gather their associated metrics in an efficient way. According to Roy, this requires three things: aligning KPI’s with enterprise objectives, ensuring data accuracy and accessibility, and developing the business maturity to implement processes from the top down.
The challenge is often gathering the raw data from multiple systems and compiling it in a way that is suitable for decision-making at the management level.
“When we talk with our clients,” says Roy, “the biggest issue is often that they’ve spent all this money on implementation systems that have a lot of data, but they don’t know how to get to that data and make it meaningful. Their real estate executives want to know, ‘What are our costs, what is our revenue, where are we headed?’ But the data is not in a reportable condition. Typically, it’s incomplete or not maintained. As a result, the senior executives can’t get the metrics and KPIs that they’re looking for.”
Once KPIs are defined, organizations may need to reorganize some of their processes to capture the right metrics. This helps align the greater business process with the organizational goals to achieve a higher level of maturity and optimization.
KPIs Are Metrics, but Not All Metrics Are KPIs
The difference between KPIs and metrics is that a key performance indicator has a designated target, while a metric is simply a unit of measurement—such as the number of buildings, the number of employees, or the number of vacancies.
“A KPI has a target—like 85 percent utilization,” says Roy. “In that case, percentage of utilization is the KPI. To really be actionable, KPIs need to be quantifiable and data-driven. That’s what takes the subjectivity out of it.”
Determining the right KPIs depends on the strategic goals of an organization. Ideally, KPIs are based on “SMART” goals—goals that are specific, measurable, actionable, aligned, and time-bound.
“If your business driver is to reduce cost by 50 percent in the next two years,” says Roy, “that becomes a smart goal, because it’s very specific, measurable, attainable, and time-bound. And now you have your KPIs identified, because, in order to decrease cost per-person, you need to be able to track area per person, cost per square footage, and things of that nature. The challenge is that measuring cost per square foot comes with a wide range of variables. That is the most difficult part. All of the data isn’t in any one system. It exists in financial systems, HR systems, building automation systems, and energy tracking systems.”
A significant factor in getting useable metrics out of multiple systems is engineering daily business processes to support the desired KPIs.
“There are three types of measures and metrics that you should be thinking about,” says Roy. “At the high level are financial metrics. Executives are looking for just that and only that. Then you have operational metrics. Those are for planners, schedulers, and people who run the system on a daily basis. Third, you have data quality—which is perhaps the most important aspect. You need to know that your raw data is accurate and complete; that you have data integrity; and that you have exception reports in place. Otherwise what you get back out is kind of meaningless.”
Once the right metrics and KPIs are identified, initiatives can be established and performance measured using a dashboard and scorecards.
“The idea is that if you know where you are before the initiatives were implemented, you will know how you are doing after they are done, because your KPIs are aligned,” says Roy.
Dashboards and Scorecards
Both the “dashboard view” and the “scorecard view” of KPIs are valuable. A dashboard gives executives a one-click view of performance in relation to specific organizational goals, quarter over quarter. The scorecard view is a matrix indicating performance across multiple dimensions.
A balanced scorecard, commonly used across the industry, presents the progress of KPIs from four key perspectives: financial, external, internal, and innovation.
“From the financial perspective,” says Roy. “You are answering the question: ‘How do we look towards our shareholders?’ From an external focus, it’s, ‘How do our customers see us?’ From an internal focus, ‘What must we excel at?’ And from an innovation perspective, ‘How do we continually improve and create value?’”
A Case Study
GlaxoSmithKline recently engaged CFI to help them achieve optimal performance across all of their facilities by harnessing their data.
“It was a very simple engagement,” says Marian Carter, senior business consultant for CFI. “They had a system in place. But they were getting individual reports from disparate resources including third-party service providers, their financial system, and their CAFM system. They wanted to identify the key metrics, capture that information, and bring it up to an enterprise level, where they could monitor performance across all their managed facilities.”
The GlaxoSmithKline engagement had two key components: to capture all the disparate data elements, and to determine the right metrics and KPIs and develop a decision support tool capable of serving up the data in a strategic dashboard.
To determine what the KPIs and metrics should be across the organization, CFI interviewed all the people involved in the real estate organization, including third-party service providers.
“We came up with about 45 metrics,” says Carter. “Half of them were around space planning, space management, occupancy, and how space was being used versus what it was designed for. The other half was looking at facility costs across the enterprise on a building-by-building basis.”
CFI performed an analysis to capture the data points and determine where the information lived—whether it was in the financial system, a service provider’s system, or the CAFM system.
“Once we understood what the key data points were,” says Carter, “we looked at things from an executive level to establish what processes they needed to adopt to create a reporting tool that would allow them to enhance their performance across the entire enterprise.”
CFI took each metric and laid out what data points were required to track things like utilization, vacancy, and costs.
“Then we asked them to run a report straight from the database, so we could see the values,” says Roy. "We did that with all the relevant systems in place. This helped us analyze things very quickly, as opposed to going in and looking at it.”
The gaps in the report revealed the initiatives that need to be implemented in order to capture the right information. In some instances, the CAFM system had the functionality to provide the required information, but it was not being captured.
“So that became one of the initiatives that we put into place. They had to capture this information in their systems in order to be able to report on it,” says Carter. They had also not been keeping data about what a space was originally designed for versus what they were actually using it for. They lost that history. So that was a big focus area for them. It took a physical walk-through to get that information.”
Once the data points were established, CFI also came up with a set of work streams to help GlaxoSmithKline develop a reporting tool they could use to optimize performance across the enterprise.
“We said, ‘You have to get your teams together going forward,’” says Carter. “‘You have to figure out what your processes are and document them.’ We also put together a three-year plan establishing the initiatives needed to reach their goal of having true reporting dashboards.”
“There are essentially three things you have to be able to do to get there,” says Roy. “Align KPIs with your enterprise-wide objectives, ensure data accuracy and accessibility, and focus on your overall business maturity. That will ultimately take you to the critical business drivers that every organization or institution looks for.”
By Johnathon Allen
This report is based on a presentation by Mayu Roy and Marian Carter at Tradeline’s Space Strategies 2013 conference.
| Organization |
|---|
|
Computerized Facility Integration
|

