While the term “strategic facility planning” is often used generically to refer to a variety of initiatives, it is actually a unique discipline with a distinct meaning, says Debora Hankinson, architect and director of Strategic Facility Planning at CRB Consulting. As an end product, a strategic facility plan (SFP) is the overarching document that sets the direction for all further planning activities, from master (or campus) planning to the tactical steps of capital projects planning, move management, and deferred maintenance planning.
To avoid misinterpretation, Hankinson recommends following the definition presented by the International Facility Management Association (IFMA) in a 2009 white paper: “a two- to five-year facilities plan encompassing an entire portfolio of owned and/or leased space that sets strategic facility goals based on the organization's strategic (business) objectives.”
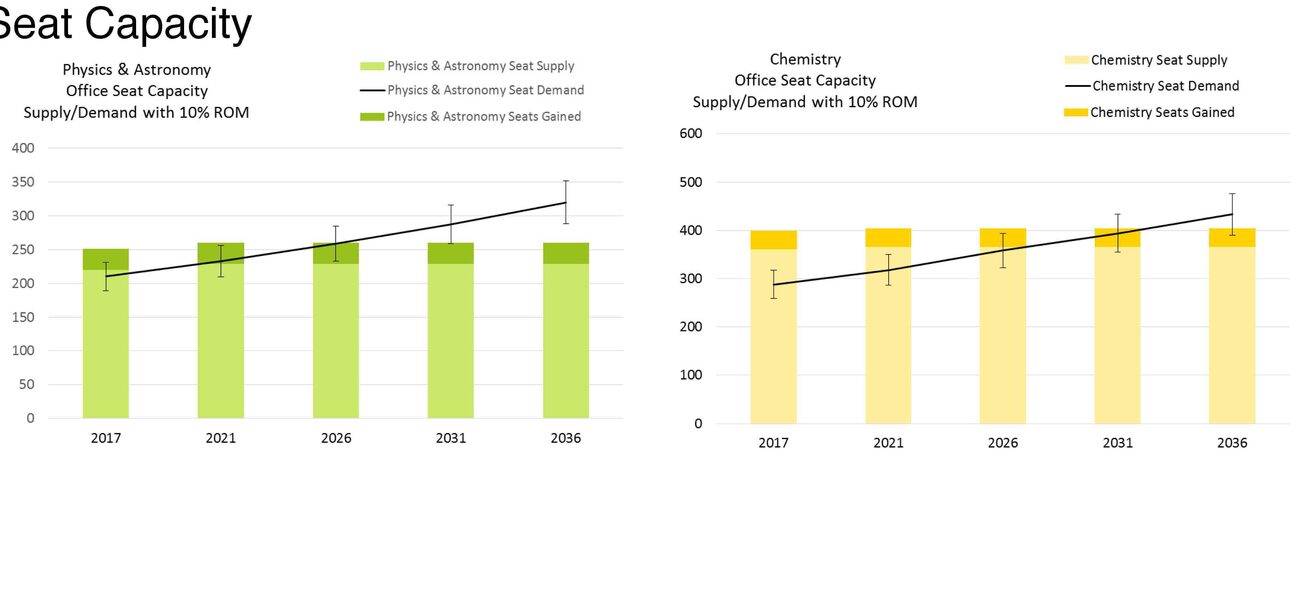
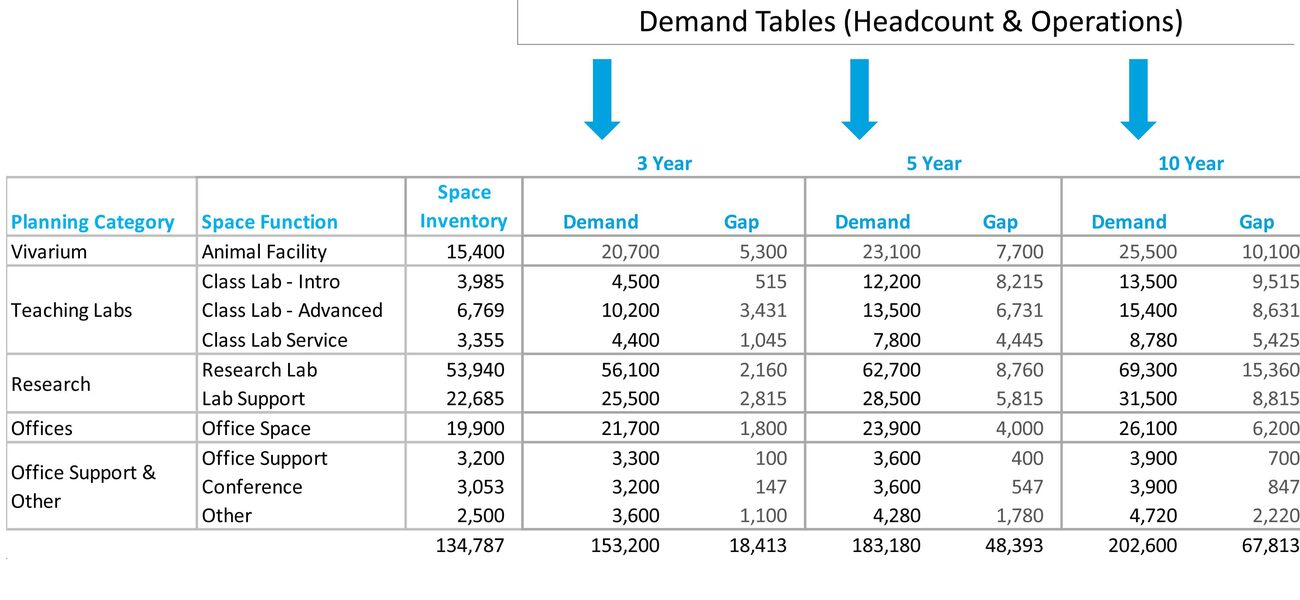
At its core, an SFP answers the questions of what facilities an organization will need, and when they will be needed. Whether applied in the for-profit or academic arena, it is essentially a supply-demand gap analysis, comparing current inventory and utilization to the forecasts in the business plan.
That sounds simple enough, but how do you get there?
The answer lies in extracting the data that resides in an organization’s already-deployed space management software—“an untapped resource just waiting to be mined,” says Hankinson—and then marrying that data to the business plan objectives. The resulting SFP will be a high-level distillation of facilities data, organized in a succinct format (often a 20-minute PowerPoint presentation) that conveys only the space details necessary for decision-making in the executive suite.
“With the correct attributes assigned, space inventory data can be repurposed to provide a comprehensive, bottom-up assessment of space utilization and capacity, and establish data structures and metrics for long-range strategic facility planning,” says Hankinson.
Understand the Business Plan
The first step in the SFP process is knowing the business plan, which lays out the organization’s plan for growth, says Hankinson. The importance of the relationship between the business plan and the SFP cannot be overstated.
“Facilities are there for an organization to conduct its business. You can’t do an SFP without understanding the goals and objectives identified in the business plan. These drive everything else.”
The critical parts of the business plan for this process are the numbers: headcount projections and sales and manufacturing forecasts. These numbers establish the drivers for the SFP.
Space Management Tools Provide Data
With these reference points determined, the next step is to look at existing inventory. Most of the requisite data is available from the space management software.
“These are typically CAFM (computer-aided facilities management) or IWMS (integrated workplace management system) software tools like Archibus, CenterStone, TRIRIGA®, or FM:Systems,” says Hankinson. “Sometimes, especially in the academic environment, the space management tools will be simpler—Revit®, Bluebeam®, or even Excel.”
The big challenge is that these systems contain a fire hose of data, and planners need to know how to extract the baseline data without being overwhelmed—or overwhelming their audience.
“The thing about those tools is that they are room by room,” Hankinson explains. “They are granular, and there are fields that you will probably never even need to know about for strategic planning. But you do need to understand what you have.”
The flip side of this abundance is that the data can be easily exported to an Excel spreadsheet, where it can be organized, analyzed, and expressed graphically for executive decision-making.
“Often, not knowing the software keeps planners from accessing this great data, but every one of the tools I mentioned has a feature enabling an Excel data dump. You don’t have to learn the space management system to access your data.”
Taming the Fire Hose
The Excel tool is where the business plan goals are interpreted and compared against the tactical database, so gaps can be identified.
Hankinson has created a six-point checklist of the data that needs to be culled:
- quantity of space: assignable nsf and gsf
- location: city/site, building
- users: business unit (or college), and department
- space classification: executive planning category, space function (use category), space type
- condition: useful life
- utilization and capacity: headcount and other metrics
She describes the first three data clusters as “low-hanging fruit”—straightforward, easily accessible, and quickly summarized.
“In general, the net square footage is what is populated in the room-by-room database. You can get gross square footage by looking at the whole building. You don’t need to dive into that in detail.”
The latter three take more time to develop.
Space classifications are generally not included in space management software, so they will have to be added by creating fields that capture how the space is being used. The process starts by categorizing rooms by function or use and type. In the private sector, the Building Owners and Managers Association (BOMA) guidelines are used to identify function and type. In academia, use category descriptions are taken from the Facilities Inventory Classifications Manual (FICM).
With this done, the spaces can then be aggregated into the major activities of interest to leadership. This is accomplished by inserting an executive planning categories field into the space management tool. Hankinson emphasizes that, in order to provide the big-picture view needed by decision-makers, the categories must be appropriately high level. For example, labs of all types might fall into a single space category of research.
“It doesn’t really matter to executives and senior planning administration whether a lab is a lab or lab support, or assigned or not,” she says. “Those details are important at a tactical level, for grant-tracking or indirect cost recovery, perhaps. But to speak to executives, the data need to be aggregated.”
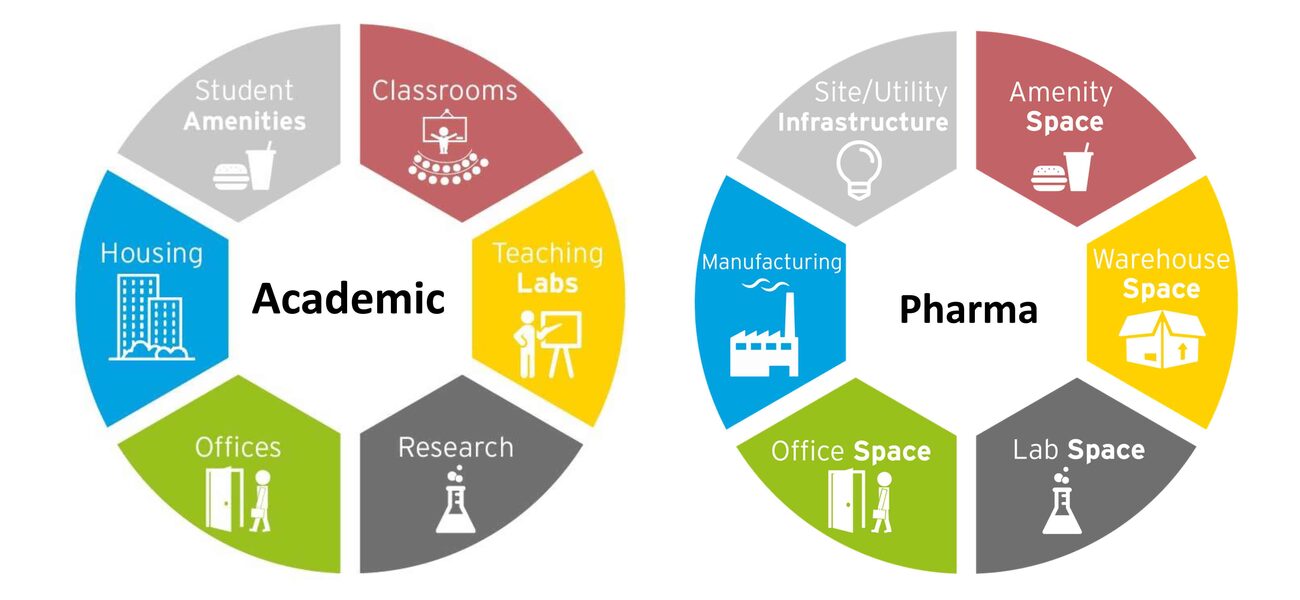
While broadly generic, the executive planning categories can vary according to the environment. For a university, Hankinson identifies classrooms, teaching labs, research, offices, housing, and student amenities. For a pharmaceutical manufacturer, she specifies amenity, warehouse, lab, office, manufacturing, and site/utility infrastructure.
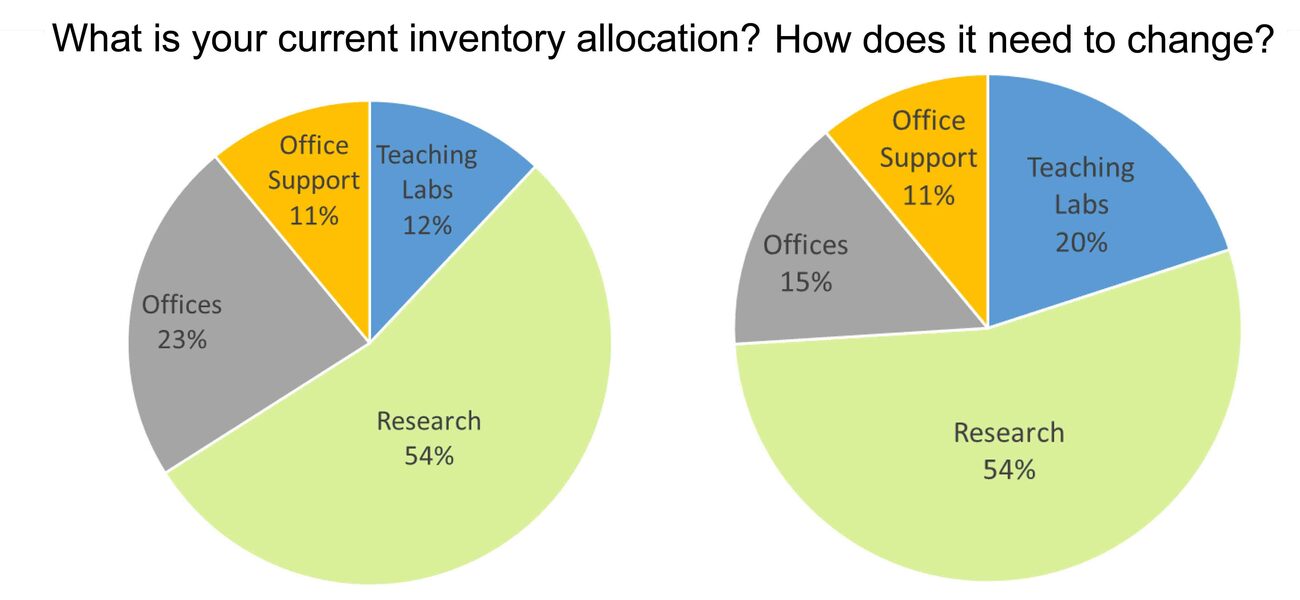
The different space categories are then analyzed as a percentage of total space and translated into a visual format. Hankinson favors the pie chart for its quick ability to convey current inventory distribution. The allocation figures then serve as the baseline for any future change.
“Once you have that, then you can start to tell a story at the executive level,” she says.
Space condition—or useful life—is another data point typically not captured in the space management tools. Hankinson suggests two methods to arrive at a numerical assessment. One is to use the four criteria formulated by the National Science Foundation: superior, satisfactory, renovate, and replace. While originally intended for labs, these ratings can be applied to any type of space. Another option, often available in academia, is the Facility Condition Index (FCI) score, a number on a scale from zero to one that expresses the ratio between the renovation and replacement cost of a building. (A number close to one signals the need for a new building.)
“Once that categorization is added to the tool, then you can start to quantify how much square footage falls into each category,” says Hankinson.
Capturing Capacity and Demand Across the Portfolio
The sixth item on the checklist—space utilization and capacity—is the meatiest part of the SFP exercise, what Hankinson refers to as the “holy grail.” Essentially, this step tallies up current utilization and capacity and compares the numbers to the demand forecast in order to reveal the gaps.
Hankinson emphasizes that the IFMA definition of SFP encompasses the entire space portfolio, also noting that while space management tools are very effective for collecting data on office space, this is likely not the only space type in the portfolio. Most organizations have more—labs, warehouses, or manufacturing, for example.
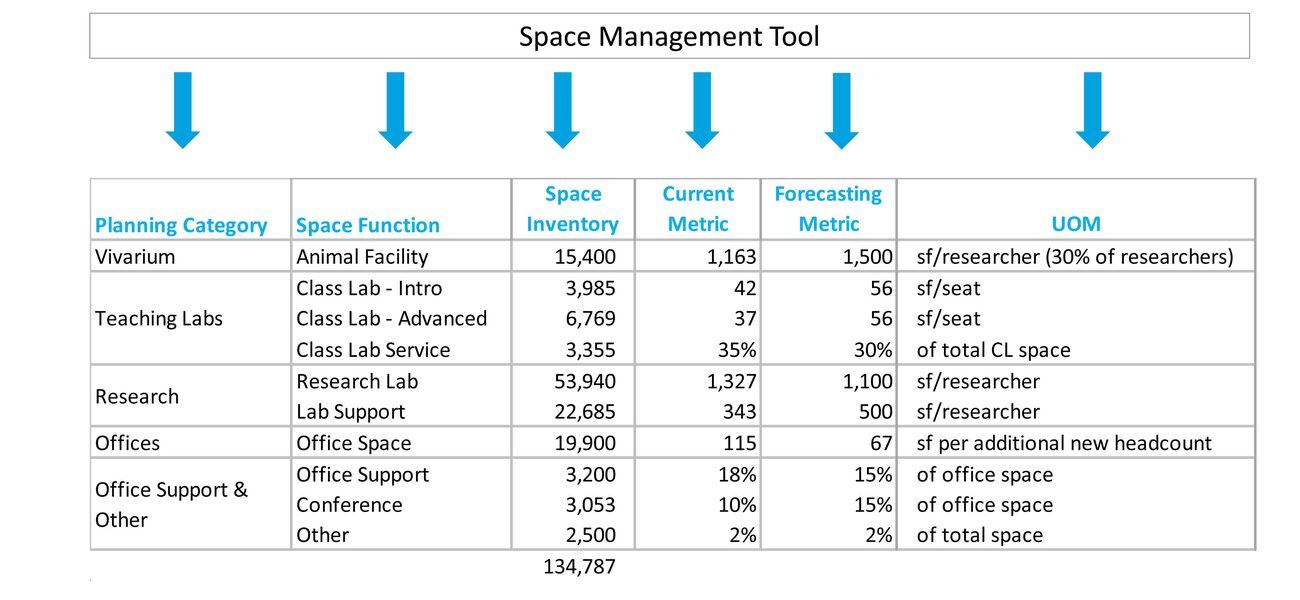
How can the space management tool be leveraged for all space types to capture the entire portfolio? It begins with looping back to the business plan to extract the demand drivers, and then linking them to the appropriate units of measure. The demand drivers will vary according to each space function or use category. In academia, there might be an increase in enrollment, faculty, or research dollars. In manufacturing, there could be secondary drivers like the addition of process space, new equipment, or material storage. Regardless, most space allocations are governed by headcount. As Hankinson observes, “People drive space.”
“Coming back to headcount for all the demand drivers makes the strategic planning process really straightforward and simple, something that speaks to executives and senior administration,” she continues. “This is not about programing or designing space. It is high-level forecasting based on headcount, using the same language so that you can understand how the portfolio breaks down into different space categories.”
The utilization metrics are based on factors that determine space quantity—people, materials, or equipment. Common metrics are the number of seats or square footage per person, or, secondarily in a production facility, square footage per process or pallet. The resulting calculations yield the numbers that reflect current utilization and form the basis for the gap analysis, the comparison to forecast demand. A field to capture a forecasting metric can be created in the space management tool.
Hankinson notes that there may be a few areas—such as office support, janitorial closets, or restrooms—where the metrics are not as solid as the others. In these cases she advises following the 80-20 rule to avoid getting too deep into the data. Because they represent such a small percentage of the space inventory in the total portfolio, the metrics for these areas don’t need to be precise.
“If you can accurately link 80 percent of your portfolio to the demand drivers coming out of the organization’s business plan, then you can just let that 20 percent tag along. For example, office support can be conveyed as a percentage of office space. Don’t get into the weeds. The key is that 80 percent of the metrics are rigorous.”
Final Analysis
The final results will be an executive demand summary of overall net square footage growth projections across a specified planning horizon. (Universities typically project out as far as 20 years into the future.) The supporting data can be sliced and diced in a variety of ways—illustrating different growth rate scenarios, pinpointing where the highest space projection increases will occur, or even broken down into the percentages of existing square footage, renovations, and new construction that will be required to satisfy the forecast demand. Paramount is that the SPF provides leadership with just the highest level of information necessary to make future space decisions.
With fields for utilization and forecasting metrics set up in the space management tool, it will be relatively simple to repeat the exercise—at least once a year, if not every six months—to incorporate fresh input, advises Hankinson.
“Things will change—the business objectives, enrollment, headcount. When that happens, the gap analysis will change accordingly,” she concludes.
By Nicole Zaro Stahl
Debora Hankinson will be leading the Fundamentals of Space Planning and Space Management pre-conference course on Sunday, October 14, 2018, in Scottsdale, Arizona, in conjunction with the Space Strategies 2018 conference.
