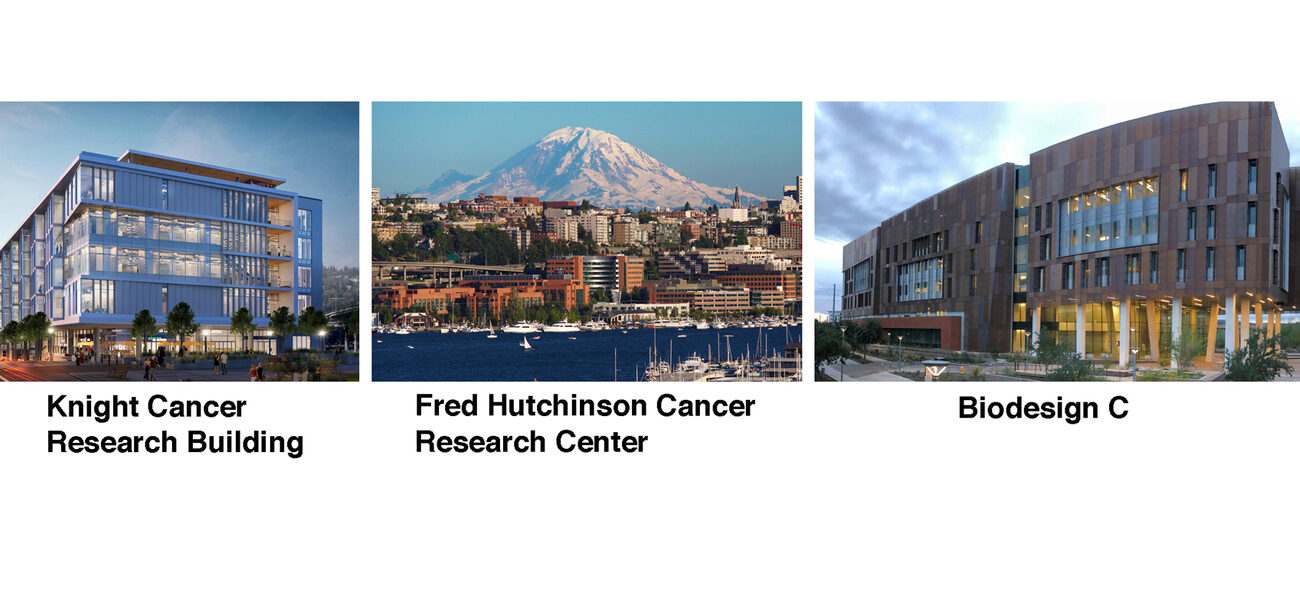
Courtesy of (left to right): Oregon Health & Science University; Fred Hutchinson Cancer Research Center; Erik Halle, Arizona State University
By Steven L. Westfall, Ph.D.
Founder and CEO
Tradeline, Incorporated
When newly constructed science buildings fail to meet the complex operational requirements for their intended science programs, coveted faculty and researchers, as well as top students, have been known to go elsewhere; research grants have been lost; aspirations for meeting energy and carbon footprint goals have been dashed; and institutions have suffered financial losses and damaged reputations. The most common cause for these negative outcomes is a costly planning gap between capital project management and operations that results in post-construction staffing for operations and maintenance (O&M) that is too little, too late, and unprepared.
“We capital project directors are responsible for scope, schedule, and construction budget,” says Robert Corbett, director of regional projects and development at the University of Connecticut, “but the criteria for project success are ultimately design, build, and operate, and that leaves a potentially costly gap between build and operate that institutions don’t always bridge.”[i]
Project planning gaps leading to post-construction operational failure occur for various reasons:
- Capital project directors don’t think that they can or should make operational success a capital project management issue (the “someone-else-runs-it” gap).
- O&M and institutional financial leadership fail to engage, plan, and take action early in the life of a new capital project on the subject of post-construction operational success (the “deal-with-that-later” gap).
- There is a lack of understanding, agreement, and commitment on the part of project stakeholders (project directors, science program leaders, and institutional financial officers) on a definitive number (or the method for arriving at the number) of O&M personnel that will be required for a new building’s operational success (the “vagueness” gap).
This paper demonstrates a capital project planning protocol for bridging the build-vs.-operate planning gap for a science building of any size and complexity by calculating, in the early project design stages, the expected number of O&M personnel that will be needed for post-construction operational success and using that headcount as an early project planning issue on which to engage O&M, facilities management, and financial leadership in making early plans, commitments, and actions for O&M staffing.[ii]
In particular, this paper:
- makes an important clarification in the use of the word “operations” in the context of science buildings and science programs
- illustrates how the unique Mission Complexity of a building affects O&M staffing
- presents a tested algorithm for quickly calculating expected O&M headcounts for science buildings using project data available as early as schematic design
- sets out a table of findings on the impact that capital project variables have on O&M headcount
- provides sample O&M calculations and staffing examples for representative science buildings of different sizes and Mission Complexity
- prescribes three capital project action items for post-construction operational success
Clarification: Facilities Operations vs. “Operations”
The subject being addressed here is Facilities Operations & Maintenance—that is, the function of planning and executing the tasks necessary to keep buildings and all their constituent parts operating properly with respect to the expectations and requirements of institutional owners, building occupants, and regulatory agencies and powers. This is an important point of clarification for science buildings, where the word “operations” is commonly used by science program stakeholders to refer to personnel involved in such program-support operational activities as concierge services, glass wash, chemical supplies, vivarium and core facilities functions, user equipment servicing and maintenance, loading dock and materiel logistics, inventory management, maker space supplies, student training and certification on the use of tools, room and equipment reservations, student project storage, access control, security, and waste disposal. These latter functions, while being essential “operational” activities for successful science programs, are quite a different matter than facilities O&M, which is the subject of this paper.
Hard Data and the Mission Complexity Effect
Exhibit 1 below shows actual reported O&M headcounts per million gross square feet (mgsf) for 30 different space portfolios from 29 institutions, where the low-to-high range is from 12 heads/mgsf to more than 60 heads/mgsf—a five-fold difference between the lowest and highest O&M headcounts per unit of space.
exh_1_version_2.jpg

This extraordinarily wide range of O&M headcounts per unit of space suggests a broad spectrum of Mission Complexities reflecting different amounts of different types of space, different types of occupancy models (numbers and types of building occupants), economies of scale, and sources of building heat and/or steam (energy). It is reasonable to conclude that 65 O&M heads/mgsf represents staffing for a very different Mission Complexity than does a staffing model of 12 O&M heads/mgsf.
If the different Mission Complexities associated with each of the data points of Exhibit 1 were to be quantified in some manner, one would expect to see a graphical relationship between Mission Complexity and O&M staffing/mgsf, possibly like that illustrated in Exhibit 2.
exh_2_version_2.jpg

That such a quantifiable relationship does exist, and can be computed, is illustrated below in Exhibit 3, where an algorithm for computing Mission Complexity based on space types, occupancy models, economies of scale, and sources of heat and/or steam has been applied to all 30 data sets associated with the O&M staffing numbers illustrated in Exhibit 2.
exh_3_version_2.jpg

The algorithm that produces the linear relationship between the hard data numbers for O&M staffing per million gross square feet shown in Exhibit 3 and their corresponding calculated Mission Complexity numbers is the following:
O&M Heads/mgsf = 10 Heads/mgsf x Mission Complexity (MC)
where,
MC (Mission Complexity) = Sw x (1+Ow) x (1-Es) x (1-Elm) x (1+Bhs)
and,
- mgsf is millions of gross square feet.
- MC (Mission Complexity) is a calculated number that is a function of the mix of space types in a building (Sw), an occupancy factor (Ow), economy of scale (Es), the labor count being sought (direct labor only, or all labor which includes allocated centralized functional O&M support) (Elm), and the source of heat and/or steam (Bhs).
- Sw (Space weight) is the average space weight for the entire building or group of buildings, where different space types—dry labs, wet labs, hi-X spaces (vivaria, containment, cleanrooms, pilot plants), clinical care, offices, classrooms, high-bay spaces, and a number of other space classifications—have relative weights that are multiples of the weight of 1.0 that is assigned to office space (see Table 1).[iii]
- Ow (Occupancy weight) is the number of building occupants times their respective O&M occupant weights (see Table 1) divided by the number of office workers that would be housed in an equivalent-size office building at 250 gross square feet (gsf) per office worker.[iv]
- Es (Economy of scale) reduces Mission Complexity, and the expected O&M labor/mgsf, for larger buildings and large portfolios of space (multiple buildings) based on observed labor economies per square foot—0% labor economy per square foot for buildings under 25,000 gsf, 4% less labor per square foot for a 100,000-gsf building, 12% less labor per square foot for a 300,000-gsf building, 17% less labor per square foot for a 500,000-gsf building, and 20% less labor per square foot for a 700,000-gsf building.
- Elm (Economy of labor model—direct labor or all labor) reduces Mission Complexity, and expected O&M labor/mgsf, by 25% if considering only direct labor and direct labor supervision with no recognition of additional labor provided by centralized O&M functional support and administration for workorder processing, work planning and scheduling, purchasing, stores, contracts, permits, compliance, records, and similar functional support. For a direct-only labor model, Elm is 25%. For an all-labor model, Elm is 0%.
- Bhs (Boiler heat source included) adds 10% to MC (and expected O&M labor/mgsf) if boiler heat/steam is generated within the building envelope.
Total O&M Heads
The total O&M headcount for a given building is simply the size of the building in millions of square feet (250,000 gsf = 0.250 mgsf) multiplied times the building’s calculated O&M headcount/mgsf. Therefore, the formula for a building’s total O&M headcount is:
O&M Heads = 10 Heads/mgsf x Size (mgsf) x Sw x (1+Ow) x (1-Es) x (1-Elm) x (1+Bhs)
Findings: The weights (impact) of Mission Complexity variables
The method used here for determining the impact that multiple variables have on producing calculated staffing numbers that correlate closely to actual reported O&M headcounts is called structural equation modeling (or multivariate structural equation analysis).[v] The weighting values shown in Table 1 are the determined weights for different variables that, when used in the O&M headcount algorithm above, yield calculated O&M staffing numbers that most closely correlate to actual reported staffing numbers—with the exception of two outlier data points. Therefore, the weighting values of Table 1 can be viewed as having been determined by 28 of the 30 space portfolios included here.
table_1_version_2.jpg

The weights for different types of occupants in a building reflect the finding that some types of occupants are higher-impact demand agents for O&M services than others. For example, in Table 1, researchers and faculty are seen to have twice the impact on O&M headcount than do office workers. Undergraduate students, as a group, are shown here as not being O&M demand agents at all. This is not to say that undergraduate students don’t cause wear and tear to the physical plant, but rather that building occupants other than undergraduate students were found here to be the effective demand agents for O&M services.
Sample O&M calculation #1 – Knight Cancer Institute, OHSU (2018)
The Knight Cancer Research Building (KCRB) at Oregon Health & Science University is a 320,000-gsf research building completed in 2018 with an expected occupancy of 585 research and administrative personnel. Underground parking accounts for 70,000 gsf of the building, leaving 250,000 gsf of programmatic space for building occupants.
exh_4_version_2.jpg

The calculation for O&M headcount is:
O&M hds = 10 hds/mgsf x Bldg size (in mgsf) x Sw x (1+Ow) x (1-Es) x (1-Elm) x (1+Bhs)
where,
- Building size in millions of gross square feet = 0.250 mgsf
- Sw (Space weight) = 1.86 (compared to 1.00 for office buildings)
- Ow (Occupancy weight) =1.08 (compared to 1.00 for office workers)
- Es (Economy of scale) = 6%
- Elm (Economy of labor model, all labor) = 0%
- Bhs (Boiler heat source included) = 0% (no in-building heat/steam generation)
O&M heads (all labor) = 10 x 0.250 x 1.86 x (1+1.08) x (1-6%) x (1-0%) x (1+0%)
Calculated O&M heads (all labor, direct and O&M functional support) = 9.1
KCRB’s expected O&M staffing of 9.1 heads is nearly twice that of the expected O&M staffing for an equivalent-size, fully occupied office building. The difference in Mission Complexities between KCRB and an equivalent office building is illustrated in Exhibit 4. Expected O&M headcount for an equivalent-sized, fully occupied office building would be 4.7.
Sample O&M calculation #2 – Biodesign-C, ASU (2018)
The Biodesign-C building at Arizona State University is a 191,000-gsf science building completed in 2018. The publicly available data on which this O&M headcount calculation is based was available in the building’s early design stages. The calculation below for Biodesign-C’s expected O&M headcount is for direct labor only (trades and trades supervisory) where allocated centralized O&M functional support and administration has been excluded from consideration.
exhibit_5.jpg

The calculation for the Biodesign-C O&M headcount is:
O&M hds = 10 hds/mgsf x Bldg size (in mgsf) x Sw x (1+Ow) x (1-Es) x (1-Elm) x (1+Bhs)
where,
- Building size in millions of gross square feet = 0.191 mgsf
- Sw (Space weight) = 2.1 (compared to 1.00 for office buildings)
- Ow (Occupancy weight) = 0.54 (compared to 1.00 for office workers)[vi]
- Es (Economy of scale) = 6%
- Elm (Economy of labor model, direct labor only) = 25%
- Bhs (Boiler heat source included) = 0% (no in-building heat/steam generation)
O&M heads (direct labor only) = 10 x 0.191 x 2.1 x (1+.54) x (1-6%) x (1-25%) x (1+0%)
O&M heads (direct labor and supervisory only = 4.3
Biodesign-C’s expected O&M staffing of 4.3 heads is 60% greater that what would be expected for an equivalent-size, fully occupied office building. The difference in Mission Complexities between Biodesign-C and an equivalent office building is illustrated in Exhibit 5. According to this analysis, the expected direct-labor O&M headcount for a comparable office building would be 2.7.
Sample O&M calculation #3 – The Fred Hutchinson Cancer Research Center Campus
The algorithm for O&M staffing that is set out in this paper can also be used to calculate expected O&M staffing for an entire campus of any number of buildings. This can be useful in determining if the O&M function for a particular campus as a whole is significantly understaffed—in which case, ensuring the proper O&M staffing commitment for a new building will be critical in preventing post-construction operational failures that might be attributed to a campus-wide O&M labor shortage.
exhibit_6.jpg

The calculation for the Fred Hutch campus O&M headcount is:
O&M hds = 10 hds/mgsf x Bldg space (in mgsf) x Sw x (1+Ow) x (1-Es) x (1-Elm) x (1+Bhs)
where,
- Building space = 1.554 mgsf
- Sw (Space weight) = 2.33 (compared to 1.00 for office buildings)
- Ow (Occupancy weight) = 0.92 (compared to 1.00 for office workers)
- Es (Economy of scale) = 27%
- Elm (Economy of labor model, direct labor only) = 0%
- Bhs (Boiler heat source included) = +10%
O&M heads (all labor) = 10 x 1.554 x 2.33 x (1+0.92) x (1-27%) x (1-0%) x (1+10%)
O&M heads (all labor, direct and O&M functional and management support) = 55.8
Fred Hutch’s expected campus O&M staffing of 55.8 heads is over twice that of the expected O&M staffing for an equivalent-size, fully occupied office building campus. The difference in Mission Complexities between the Fred Hutch campus and an equivalent office building campus is illustrated in Exhibit 6. According to this analysis, the expected all-labor O&M headcount for a comparable campus of purely office buildings would be 24.8.
Capital Project Action Items for Post-Construction Operational Success
Based on this paper, there are three straightforward actions that capital project directors can and should take to help ensure that newly constructed or renovated science buildings operate successfully post-construction.
Action Item #1: O&M headcount early. As early as schematic design, calculate the expected O&M headcount using space and occupancy data available at that time.
Action Item #2: O&M personnel as building occupants. Engage O&M leadership during schematic design on what kinds and amounts of space will be needed in the building for O&M desks, files, meeting space, storage, supplies, tools, equipment, and shop areas. O&M personnel are, in fact, building occupants, and formally recognizing that fact in designing the building is a tangible and reasonable way to promote early decision-making and engagement on O&M headcount and planning for operational success.
Action Item #3: O&M headcount as the 5th project-defining parameter. Publish the expected O&M headcount early in the design stages, and continually communicate that number to all stakeholders as one of the five project parameters for project success, those parameters being:
- Occupancy—the number and types of occupants
- Gross square feet
- Construction cost
- Completion date
- O&M heads for post-construction operational success
Summary: Taking the Lead for Post-Construction Operational Success
The finding that the number of O&M personnel that will be needed for the post-construction operational success of a new science building can be substantially determined as early as schematic design within a narrow band of certainty means two things:
First, it means that as early as two, three, or even four years prior to occupancy, O&M, facilities management, and institutional financial leadership can be engaged in substantive, quantitative planning and decision-making on where the needed number of O&M personnel are going to come from, when those people will be on site and trained, what kind of space they will need in the building, and how they will be funded.
Second, it means that the capital project director is the person who has the necessary and sufficient building data on which early substantive planning for operational success can be launched. This makes him or her the appropriate person to initiate bridging the planning gap between “build” and “operate” by simply calculating the expected O&M headcount needed for post-construction operational success and getting that number on the planning table early with O&M, facilities management, and institutional financial leadership.
Steven Westfall will be presenting a special forum session on this topic at Tradeline's College and University Science and Engineering Facilities 2019 conference in St. Petersburg, Fla., in April.
[i] Robert Corbett, Director of Regional Projects & Development, University of Connecticut – statement made in his presentation to a May 2018 Tradeline conference of university capital project planners and managers in Austin, Texas, and subsequently affirmed to the author for this paper.
[ii] While taking all responsibility for the content of this paper, the author gratefully acknowledges the valuable inputs and suggestions from Erik Halle, Arizona State University; Dean Hansen, University of Texas System; Dante Tedaldi, Leidos/National Cancer Institute; Tiffany Howard, Oregon Health and Science University; Steve Frei, Affiliated Engineers; and Bob Cowan, Fred Hutchinson Cancer Research Center.
[iii] In the 1980s, IBM’s corporate facilities management group adopted the use of “multiples of office space” (office space = 1.0) as a way of quantifying the observed fact that, regardless of geographic or economic region, research labs require a greater number of O&M heads for a given number of square feet than are required for a comparable amount of office space.
[iv] 250 gsf/worker represents the total of all types of office building spaces per office worker (meeting and collaboration, circulation, amenities, public areas, storage, quiet rooms, support, alternative work places, mechanical, and building services). For scholarly reporting on the range of office space planning standards and definitions, and the difference between what space planners target and what actually occurs, see, Norm G. Miller, (2014) "Workplace trends in office space: implications for future office demand," Journal of Corporate Real Estate, Vol. 16 Issue: 3, pp.159-181, https://doi.org/10.1108/JCRE-07-2013-0016
[v] Structural-equation modeling is a multivariate statistical analysis technique that is used to analyze structural relationships involving multiple variables. This technique is the combination of factor analysis and multiple regression analysis, and it is used to analyze the structural relationship between measured variables and latent constructs. (Latent constructs are systems of weights and formulas.) This method is preferred by researchers because it estimates multiple and interrelated dependencies in a single analysis.—Statistics Solutions. (2017). Structural equation modelling. Retrieved from http://www.statisticssolutions.com/structural-equation-modeling/
[vi] The Occupancy weight of 0.54 for Biodesign-C is a low number relative to the 1.00 Occupancy weight for office/admin workers. This low number is the result of a high number of Biodesign-C occupants being undergraduate students who, according to the findings of this paper, have zero Occupancy-weight impact on a building’s O&M staffing. (See Table 1)