How do you measure the value of research? That’s the question many universities are contending with as they rethink and revise their master plans to reflect declining enrollments, a complex funding environment, and the realities of older facilities, amid competition for scarce resources. A fresh approach to space planning and benchmarking can help clarify the possibilities.
Todd Griffith, senior associate at Stantec, cites increased expenses and lost revenue from the COVID-19 pandemic adding up to $183 billion as a source of stress for universities nationwide. Capital spending and operating budgets are dropping, and institutions are facing a demographic “cliff” that will see a significant drop in the number of people of traditional college age starting in 2026.
“On top of all that,” Griffith says, “reports show that 30 percent of buildings are in the age group of 10 to 25 years, and the major systems of many of them will soon reach the end of their useful lives.” That means institutions are having to make tough decisions about whether to invest in maintaining and renovating aging buildings, or in new construction that may be difficult to fund.
“Something has to change,” says Griffith. “There has to be a different way of looking at your existing facilities that you have and what you do with them.”
Start with Space
Griffith and Alex Wing, principal for education at Stantec, have worked with many institutions on their planning and forecasting, and have developed tools and a method to make the process more useful. They describe the process they went through in a recent re-evaluation at Case Western Reserve University in Cleveland.
The first step was to evaluate the existing space. The university asked them to look only at research and support space, not office or teaching lab facilities. That added up to 750,000 sf across 25 buildings. The Stantec team has developed its own software tools to bring together all the data and drawings the institution provides, in a format that can be read on a phone or tablet as well as a computer screen.
“Once we have the information loaded, we go out across campus and we start walking,” says Griffith. “We can look at filtering—per building, per department, per floor, per room—for exactly what we’re looking at. So, if you want to look at the Wolstein building and only the biology departments in that building, what do those look like? Then we can filter through this program and give you a readout of just those departments and those floors in different buildings. Sometimes biology can be in four buildings, so we’ll get all the biology in all four buildings. How do they rate?”
While they walk around, the team asks questions. They might find, for example, that a room that’s slotted on the drawings as a wet lab was converted into an office years ago, or that no one is using it at all. They also assess the condition of the room, with a particular view to how usable it is for lab work, and document their findings with photos. Then they aggregate that data by floor and include assessments of the overall condition of each building, on both objective and subjective scales.
As you might expect, they found a wide variety of lab conditions, ranging from unrenovated 1920s buildings to facilities brought online just before the COVID pandemic hit. They also looked at whether labs were overcrowded, and found many that were. One of the Case Western administrators’ questions for Stantec was about the ratio of lab to support space, and whether their research facilities were in line with industry norms.
“I saw a situation where they actually put a sign over the electrical panel saying, ‘Whoever designed this designed it very badly. We don’t have enough wall space,’” says Griffith.
After the walkthroughs are complete, the team starts aggregating and charting their data: condition of mechanical and electrical systems, percentages of space on each floor devoted to each research department, and much more. The team used a five-point scale for scoring as a way to get through a lot of data quickly, because they had six weeks to assess 750,000 sf of research space.
Bench By Bench
Wing and Griffith used an alternative benchmarking system to help Case Western administrators zero in on the questions that were most important to them. “We are beginning to think differently about benchmarking and focusing on what we really want to measure here,” says Wing. “If we start talking about the relationship between value and area, it gets interesting.”
For instance, when assessing learning spaces, maybe the traditional seat metrics aren’t the best measure of value, and the institution might be better off tracking credits or diplomas. When you do that, space usage ends up looking different. “You end up with a constellation of learning environments,” says Wing.
Translating that idea into the research space means focusing on harder-to-track qualities, such as recruitment and retention. Research space is often allocated by team, assuming a standard size for each team, but in real life, the sizes of teams fluctuate. Wing suggests instead looking at revenue (funding) for each square foot of space, and using that benchmark when allocating space and facilities. Planners would then allocate some extra “headroom” to allow teams room to grow or flex. “This is your swing space. By investigating the range of factors which influence churn, sharing of resources, and recruitment/retention, you can build a business model that optimizes for the appropriate level of flexibility,” says Wing.
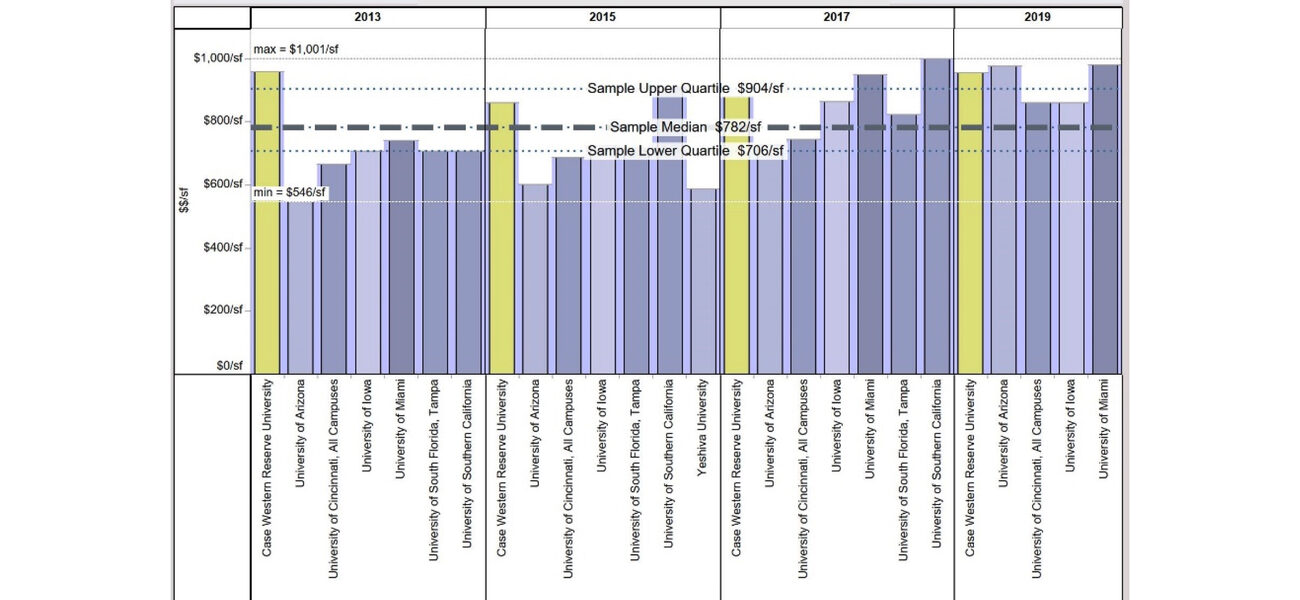
Using data from the National Science Foundation, the Stantec team built a list of benchmarks showing earnings per square foot across more than 700 institutions, broken down by department. Then they compared those numbers to the ones from Case Western and built a dashboard to help them report the results to the university. The tools help them compare Case Western’s numbers to institutions of similar size and footprint. The method allows for empirical identification of peers with similar operations, enabling real-world comparisons, as well as an investigation into how that reality compares to long-term aspirations.
Using the Numbers
The point of this benchmarking approach, they say, is that it gets to the value of research space, giving institutions real data they can use to adjust their budgets and pursue goals like increasing research productivity and funding. It also helps speed up the planning. “The tools we use let us do these things on the fly,” says Wing, “so it’s really about sitting down with the client and having a conversation about what it is they want to chart.”
It also doesn’t need to come down to a cold calculation of low funding leading to less space. “You can bring a group or department in and say, you know, relative to this peer set that we’re looking at, you are here. And then everybody can ask themselves, is this okay?” says Wing. “Maybe the answer is yes, because we’ve got a Nobel Prize laureate here who is helping to attract students and faculty, even though by any other measure, their lab is oversized. That is part of what happens in higher education. There will be politics, emotion, and other intangible reasons why we do what we do. But let’s look at some numbers together and then make some decisions about whether that is okay.”
Wing describes a building at the University of Massachusetts that resulted from a decision to radically reshape the curriculum around the idea of larger cohorts of students doing more project-based, out-of-classroom learning as a means of improving educational outcomes and the efficiency of content delivery. Coupling this approach with a new set of larger (70-person) classrooms, this change allowed UMass to deliver more credits per student station, while simultaneously improving outcomes. The new Integrative Learning Center was designed to deliver that curriculum, allowing the campus to reduce its space allocation by about 20 percent, taking older buildings offline at a time when enrollment was going up.
Recent shifts in the educational landscape have made moves like these more commonplace. “COVID has shown us the way,” says Wing. “We do not need to do things in a traditional manner anymore.”
Up Next: Decarbonization
What’s on the horizon for space planning? Griffith says many institutions are driving to reduce their carbon footprint. “If we can drive down the amount we’re building, we can help them meet those goals,” he says. New master planning projects are focused on helping the institution reach carbon neutrality by 2050, or even sooner.
“That takes us back to the big value proposition here,” says Wing. “We all have been having lots of conversations about decarbonization. We have all had been having lots of conversations about right-sizing. My question is, aren’t they the same conversation? And if not, why aren’t they the same conversation?”
By Patricia Washburn

