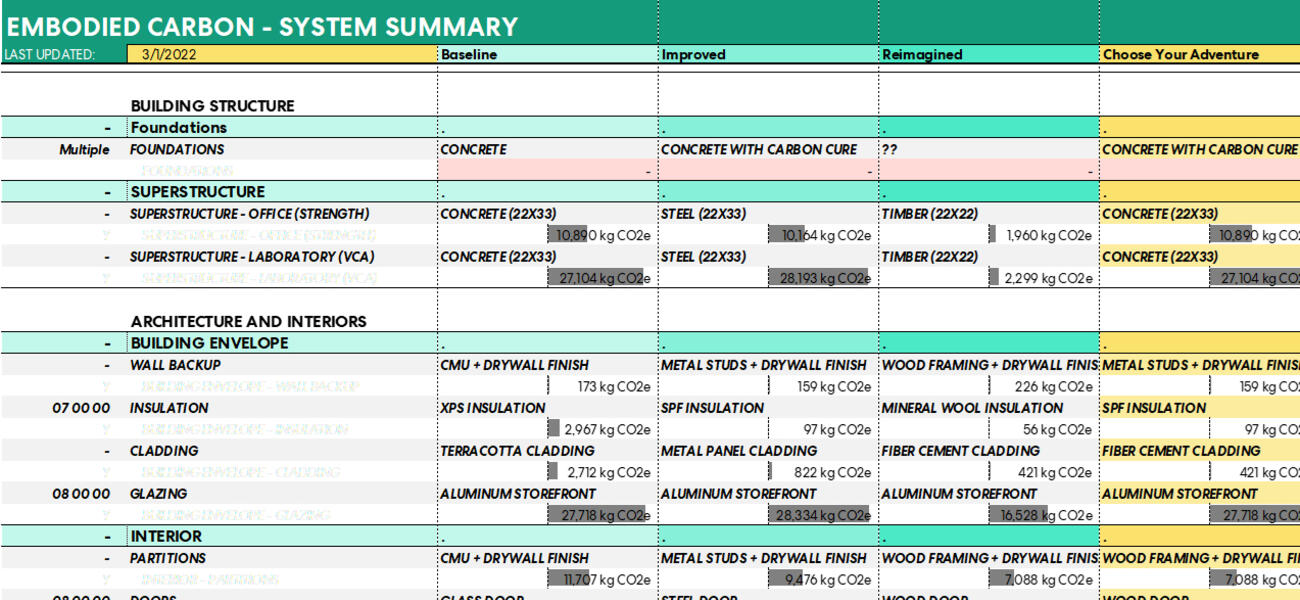
Carbon Footprint Database
Courtesy of Perkins&Will
Perkins&Will created a database demonstrating Environmental Product Declaration (EPD) variables that affect a building’s carbon footprint.
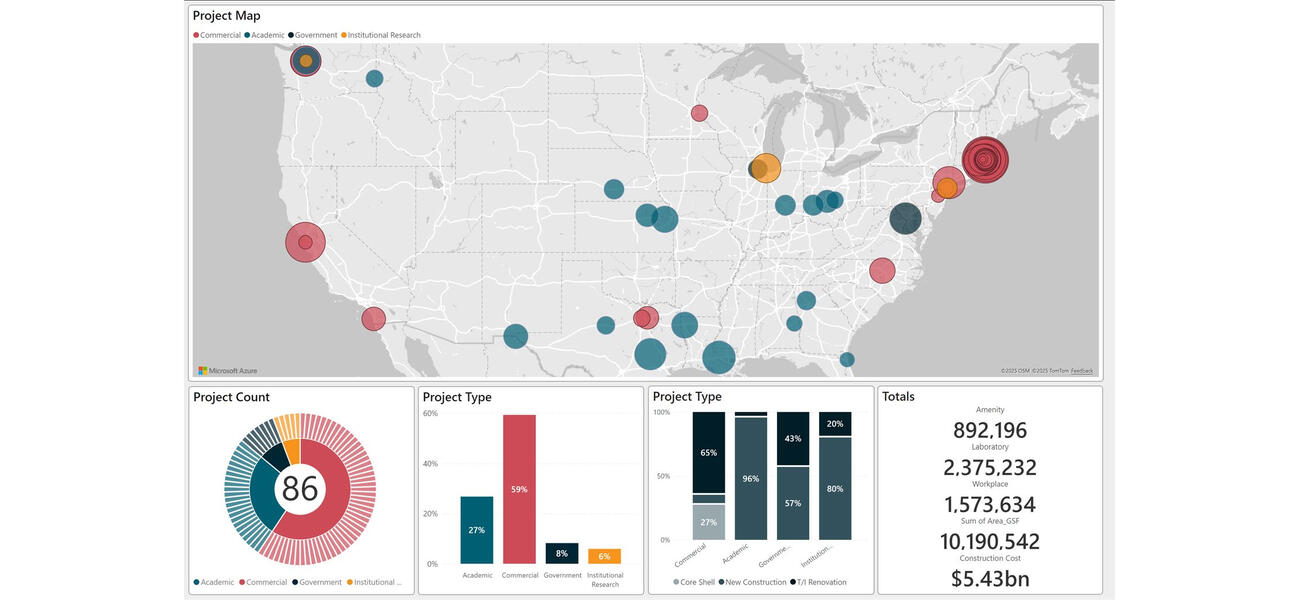
Benchmarking Dashboard
Courtesy of Perkins&Will
This dashboard allows for benchmarking across different market sectors and locations, with filters for project type and location.
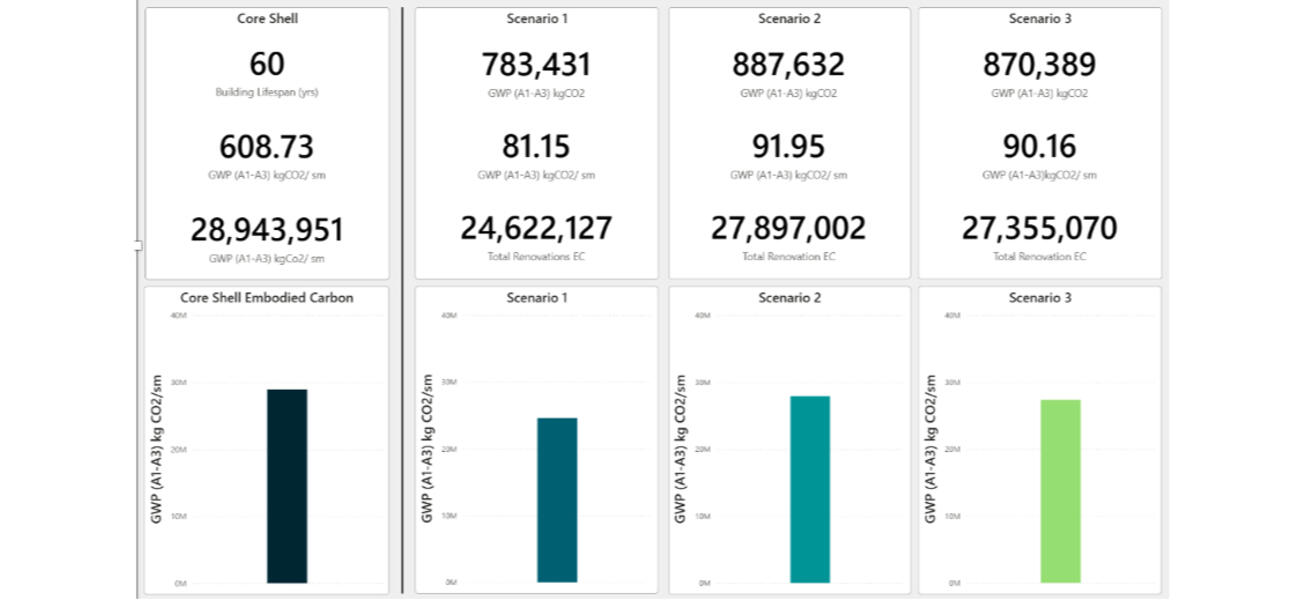
Embodied Carbon Scenario Dashboard
Courtesy of Perkins&Will
This dashboard allows for high-level embodied carbon scenario planning to understand the initial impacts and long-term implications.
Collecting and analyzing data is par for the course in facilities planning and operations. But how is that data used, for how long, and how often is it updated? Poorly curated data can be barely more useful than no data at all. But many institutions don’t know where to start or how to make the best use of data they already have. Mining and strategically analyzing information can provide data-driven insights into space needs to help increase utilization, create space planning programs, and understand carbon footprints.
“Most projects that find themselves in the world of data have a design problem that’s inherent to it, which is why we’re in a position to even talk about data as part of the solution,” says Elizabeth Mikula, LEED GA, LFA, project manager at Perkins&Will. “Talking with clients about data has become no different than how we approach programming or other pre-design efforts.”
As with any project, the first step is to identify the problem that’s being solved to determine how data can help. Some common issues include aged facilities that don’t meet modern requirements, underutilized spaces, sustainability challenges (such as energy-intensive labs), and higher operational costs. Investing in data analysis is not a one-time event, however.
“You have to make sure that the data and tools you curate don’t collect dust,” says Steve Webster, AIA, LFA, senior project architect and associate principal at Perkins&Will. “What I focus on with clients is making sure that tool can be used as time goes on and that it can be updated or manipulated. The goal is to make this live and use it day by day.”
Finding and Using Data
Data as it relates to space planning and design comes from a variety of sources and can focus on specifics about a facility, energy usage, real estate holdings, project costs, and occupancy. Existing data may also include design metrics, finance metrics, and operational data; additional source data can come from public databases or research. Gathering data that doesn’t yet exist might mean talking directly with employees or conducting on-site space surveys.
Knowing where data is stored, who manages it, and how to find it are some potential challenges. Within one organization, for instance, smaller groups might maintain disparate systems or not share information—not out of malice but because a data-sharing process doesn’t exist. And if a company or university doesn’t have an overall data strategy, personnel may not keep data updated or may lack time or expertise to create and use data analysis tools. Even when an outside firm is leading data analysis, an organization’s staff must remain involved, and that requires a shift in thinking.
“We often come as the result of a directive from higher up that we’re going to be managing some of this data and looking into data, and people are not always happy about the added work or a changed process,” says Mikula. “The biggest success out of any of these tools is users’ ability to actually utilize them and knowing how the data sets are connected.”
Mikula and Webster stress that data and dashboard models should be integrated, flexible, and platform-agnostic:
- Integrated: Dashboards can be linked to your day-to-day systems, providing a comprehensive view to drive various scenario planning options.
- Flexible: Dashboards can be customized to your needs. Custom doesn’t mean expensive; it means tailored to your organization’s goals.
- Platform-Agnostic: Tools can be desktop, tablet, or phone-based, and built to interface with your existing systems.
Once data is gathered, the chosen tools should let people model scenarios across an entire portfolio, to see how growth and planning might affect space needs or how best to increase sustainability. Tools should also allow for dynamic reporting, letting users easily create tables, graphics, and maps as ways to visualize data—which is especially helpful when presenting to decision-makers and other stakeholders.
No special tools are needed to gather and assess data, however. For most of their projects, Mikula and Webster use commonly available software, like Excel and PowerBI. But they emphasize that conclusions drawn using any tool are only as good as the data that goes into it.
“Having data is good, but not all data is equal,” says Mikula. “When you don’t maintain your data, Excel can be an absolute pain, and Power BI is not even an option.”
For instance, if data is maintained using inconsistent formats—think various abbreviations versus a spelled-out term—then it’s harder to find everything that meets your query. If data isn’t kept current, such as updating workspace allocation when someone is hired or leaves, then it doesn’t help you know who sits where or how many unused spaces exist.
“Start a project by asking yourself and the team, ‘What data are we going to care about on this project? What is important for us to maintain, to look into, and to document for ourselves?’ And make sure that you are being aware and consistent with that data throughout the project,” says Mikula.
Using Data to Optimize Space Usage
Some projects start with a simple request, such as when a university client approached Perkins&Will to determine whether or not a new building was needed to support the research being done on campus. The university knew it was out of space, but new construction on its historic urban campus would be an expensive undertaking. Before determining whether a new building made sense, first the project team had to understand what types of space existed and the state of those buildings. The initial data gathering and analysis turned into a two-year project looking at 22 buildings across two campuses. The product was an existing space assessment, which provided a guide to each building’s renewal, looking specifically at code compliance, infrastructure systems, and program impacts to show how best to invest dollars on campus. The result was a comprehensive picture of the university’s available buildings and a guide for moving forward.
“What we learned really quickly was that all of their buildings were in various states of disrepair,” says Mikula. “All of the systems were close to failing.”
Early investigations into building data showed that the university had enough space and didn’t need a new building. But it did need a way to optimize space and modernize systems. The team scored each building based on the state of its systems, and none reached 100%. To share that information with their client, they also described what would happen if structural investment didn’t happen within the next five years.
“Some of these buildings would get incredibly close to not being functional at all,” says Mikula. “This data let us communicate to leadership that some key priority buildings need to be invested in now and, if they chose not to, they’d spend more later and need to do it faster.
“We wanted to leave them not with a doorstop but with a playbook,” says Mikula. “People do studies and leave with hundreds of pages of documents, and often that sits on a shelf. Our objective was to create a roadmap for this client in order to develop renewal over the next 25 years.”
Understanding Environmental Impact
Using data to understand and reduce carbon footprints is one of Mikula and Webster’s passion projects. After working on a life science development that received a LEED Platinum rating, they wondered what would happen to its carbon footprint over time as lab floors are renovated. With funding from a Perkins&Will Innovation Incubator grant, they started to delve into this question.
“LEED Platinum only takes us so far,” says Mikula. “From an embodied carbon perspective, from a material waste perspective, we pretty much eclipse it very quickly, almost within the first set of renovations.”
By gathering Environmental Product Declaration (EPD) data for various materials, or extrapolating when EPD data wasn’t available, Webster and Mikula created a database of information that let them see how different variables change a building’s carbon footprint. With that materials information in hand, they then created a dashboard to run scenarios, allowing various material choices but also differences in space categories and types. Users can then see how more office space versus lab space affects carbon usage, for example, as well as the environmental cost of updating interiors.
“We can achieve anywhere from almost a 30% to an 80% embodied carbon reduction by making better decisions about what materials are going into your lab,” says Mikula.
This type of data-crunching, done prior to new construction or during renovations, lets planners and architects understand the impact of their choices and gives an additional way to approach environmental construction.
“People are building really sustainable and healthy buildings through the LEED process,” says Webster. “However, it’s nothing necessarily to do with the longevity or lifetime of the interior. Being able to zoom out and look at it holistically from a sustainability perspective and starting to collect more data points lets us see everything through the lifecycle of the project and the products we’re putting in there.”
By Amy Souza
Learn more about how to optimize the use of research facilities metrics at the Tradeline Science and Engineering Facilities 2026 conference. Join us in Nashville in October!